

Quick Intro
Most traders never see a big family of simple, on‑or‑off signals. There are about 122 of them. They flash a green light or a red light—nothing in‑between. Some are famous, like the Hindenburg Omen. Others stay hidden in the platform’s side menu. I’ll tell you where to look.
Binary Breadth: Simple On/Off Alerts
Usually a chart says, “The indicator might be warning,” or “A move could happen soon.” Those messages are vague. Binary breadth tools are different. They are called NBD (Normalized Binary Digital). The output is either +1 or –1, on or off. They don’t tell you exactly when to buy or sell, but they give a clear context that can shape your next step.
Thrust Signals – Rare, Powerful Moves
Thrust signals appear very rarely. When they turn on, they point to a big market shift. The name comes from a few indicators created by Martin Zweig, and later traders added more.
A well‑known example is the Zweig Breadth Thrust indicator: !BINYBTD
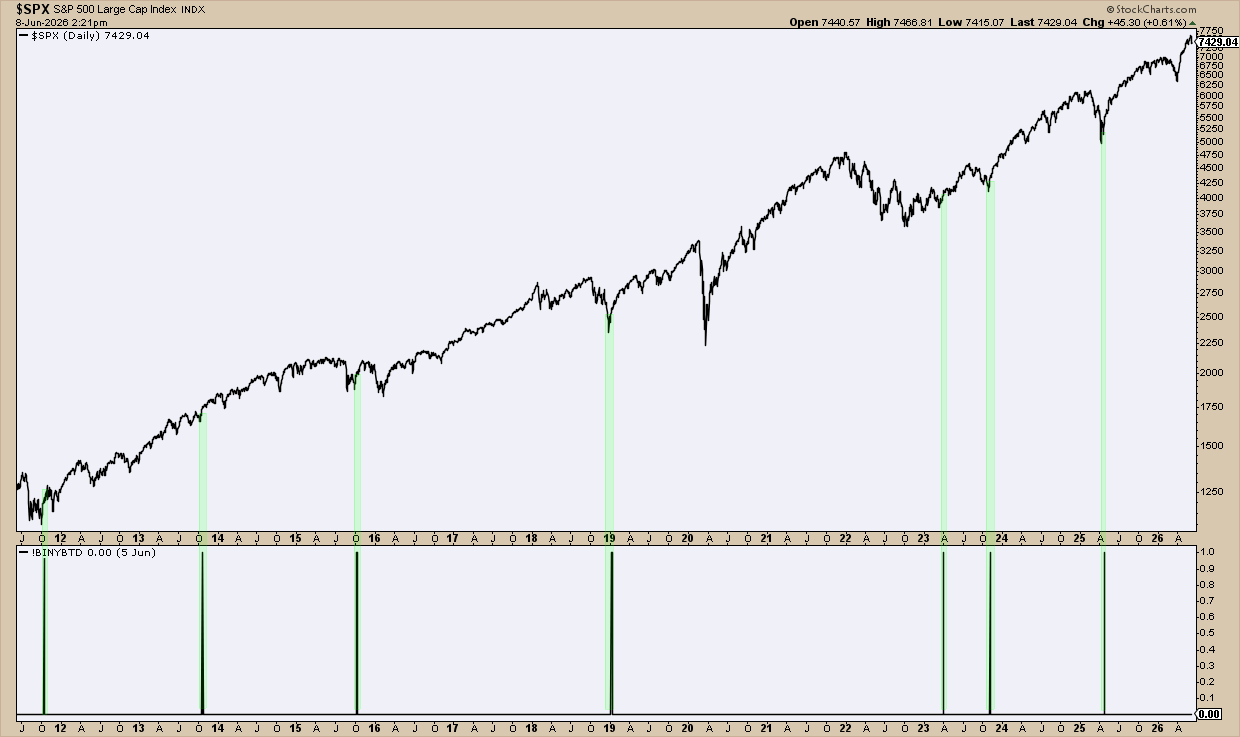
The thrust tries to catch the start of a new bull market. Signals are few, but they often appear near market bottoms and are fairly reliable.
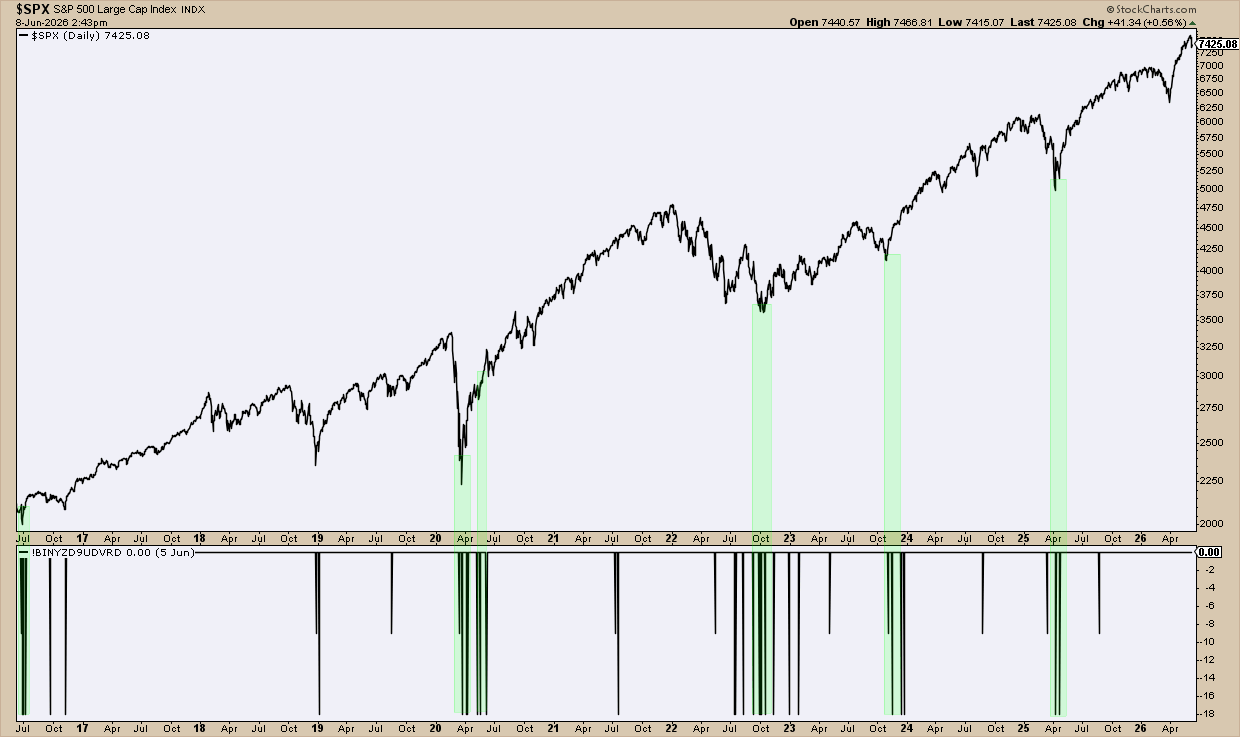
Another Zweig tool is the Double‑9 Up Volume Ratio: !BINYZD9UDVRD. It lights up when the total volume of advancing stocks is at least nine times the volume of declining stocks.
Below are a few more thrust‑type signals you might explore:
- !BINYBTCD – Breadth Thrust Continuation
- !BINYPTD – Panic Thrust
- !BINYZUDVRD – Zweig Up Volume
- !BINYZD9DUVRD – Zweig Double‑9 Down Volume
Bearish Warning Indicators
About half of the NBD tools are neutral—they can signal either direction. Some, however, are built mainly to warn of trouble.
The classic Hindenburg Omen uses the code !BINYHOD.
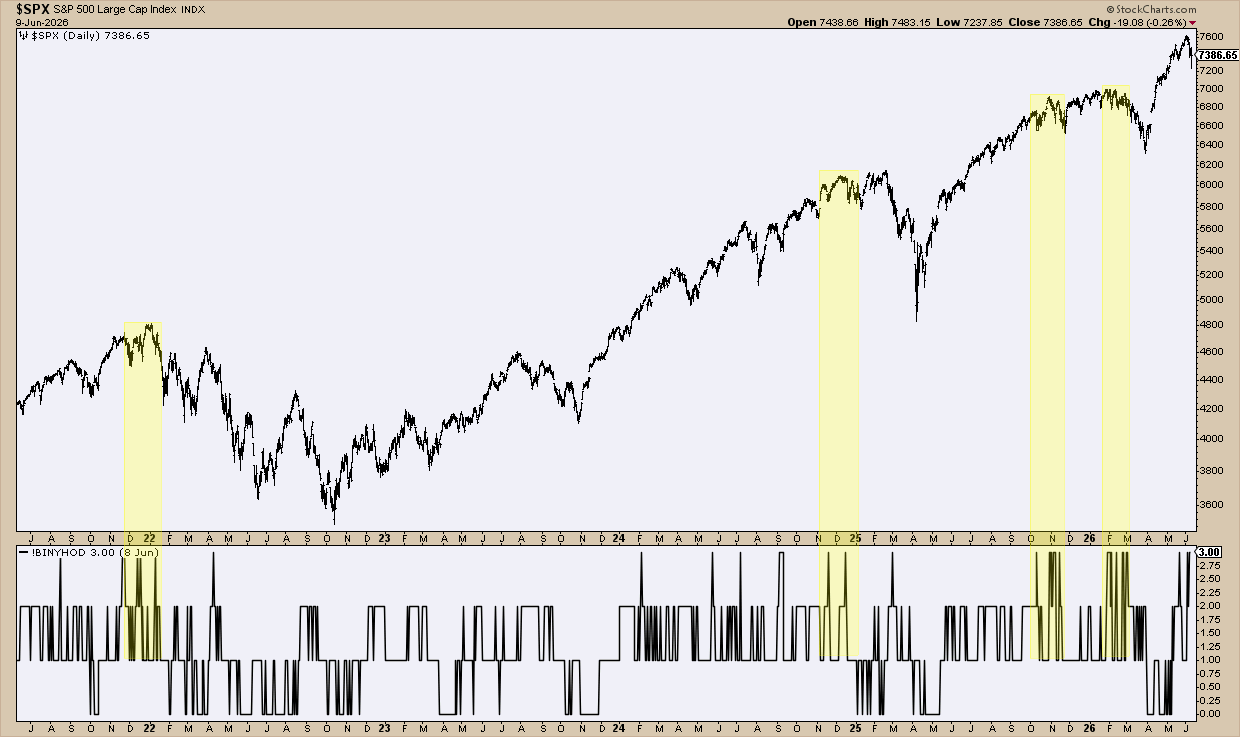
The yellow zones show where risk built up before the market fell. The timing isn’t exact, but the pattern often precedes a dip.
Another lesser‑known tool is the Titanic Syndrome (!BINYTS1988D) created by Bill Ohama in the 1960s. It tries to spot market tops.
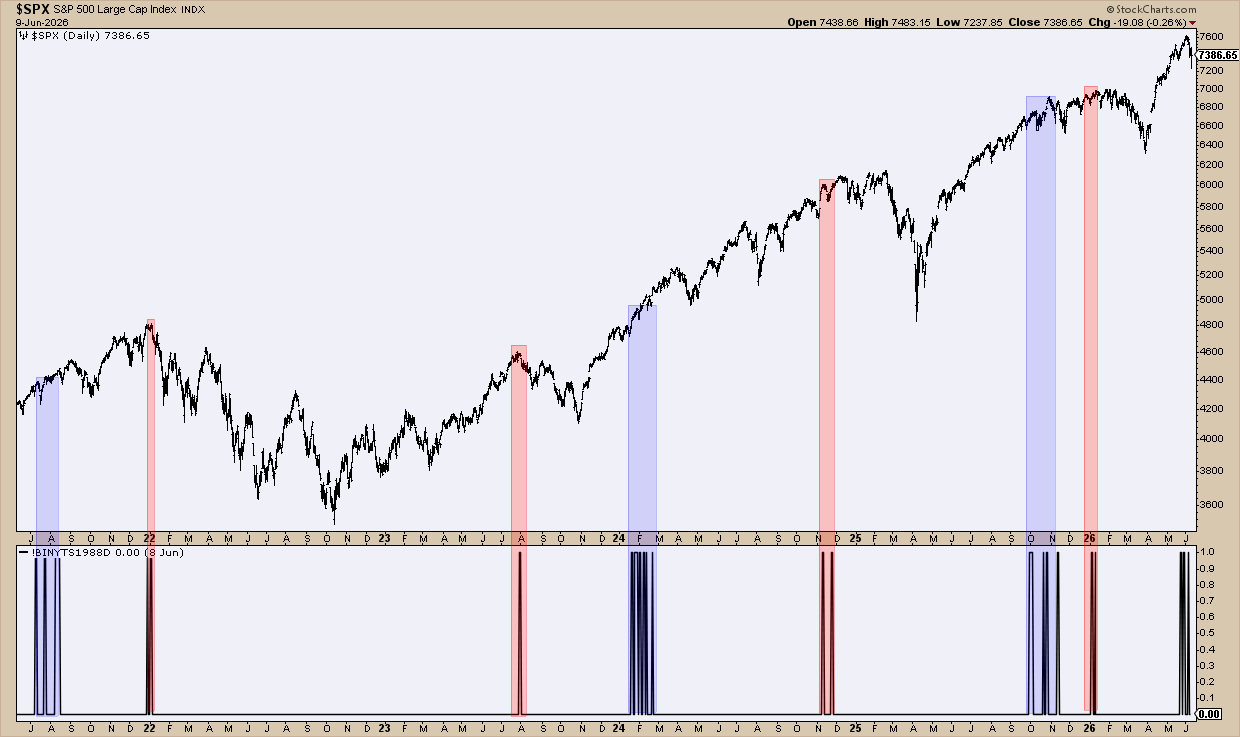
Red marks often lead to a decline, while blue marks show weaker outcomes. Remember, these are context clues, not exact timing tools.
Here are a few more bearish‑leaning indicators you may want to test:
- !BINYESOBD – Eliades Sign of the Bear
- !BINYZD9DUVRD – Zweig Double‑9 Down Volume
- !BINYDNI – Dysart Negative Issues
- !BINYHTTSDW – Haller Trend Sells (Weekly)
Indicator Families Worth a Look
Below are some groups that contain several related binary tools.
McClellan Binary Derivatives: !BINYMSIM, !BINYMSIS, !BINYMCOM, !BINYMCSM. They turn the familiar McClellan Oscillator into simple on/off alerts.
High‑Low Crossover Signals: !BINYHLXD, !BINYHLX10D, !BINYNHVD, !BINYNLVD, !BINYHLPTDW. They track new 52‑week highs versus new lows and flag when leadership may be shifting.
Zahorchak Method: !BINYZMD, !BINYZMDW, !BINYZM2D, !BINYZM2DW. Four variants that look at advance‑decline data on daily and weekly time frames.
Composite Tape Index: !BINYCTIS, !BINYCTIM, !BINYCTIL. Three signals for short, medium, and long‑term trends. When all three are on, it may be a strong sign.
Haller Signals: !BINYHTBBDW, !BINYHTTBDW, !BINYHTTSDW. They cover bottom buys, trend buys, and trend sells, giving a fuller market story.
TRIN Binary Family: !BINYTRIN10, !BINYWTRIN10, !BINYBTRIN5, !BINYBTRIN5I, !BINYAI265. These are threshold versions of the Arms Index, lighting up when extreme selling pressure appears.
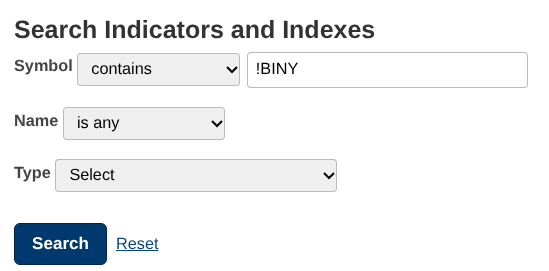
How to Find Them on StockCharts
Just type !BINY into the symbol search box on the StockCharts index catalog and hit Enter.
You’ll see five pages of results, each showing a list of !BINY indicators.
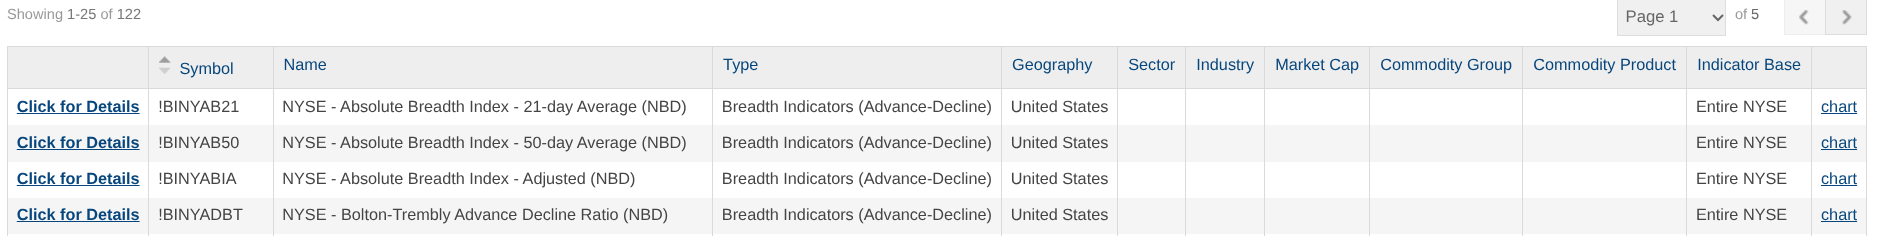
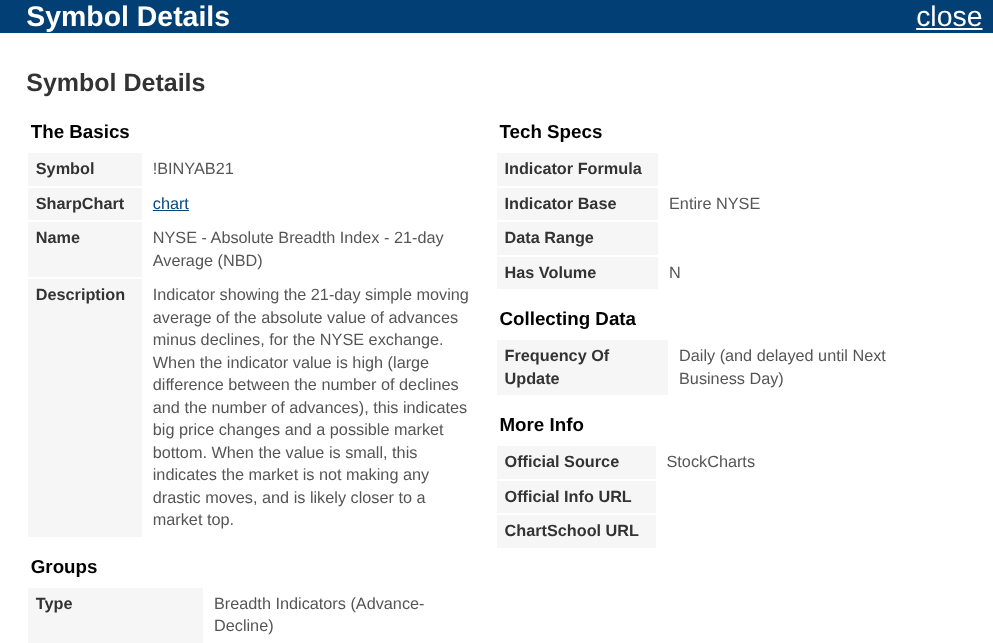
Click “Details” for any code to read a short description. For example, the first entry, !BINYAB21, is the NYSE Absolute Breadth Index – 21‑day Average.
All together there are 122 binary indicators. Some are well documented, like the Hindenburg Omen. Most are not, so you’ll need to experiment and see which ones fit your style.
Wrapping Up
These 122 on/off tools give a different kind of market context. They won’t tell you exactly when to buy or sell, but they can highlight risk, momentum, and possible turning points that many traders miss. Test a few, keep the ones that help, and ignore the rest.
Source: Materials provided by https://articles.stockcharts.com.Note: Content may be edited for style and length.