


Last week the market watched the latest data from the SPCX index, and this week the Federal Open Market Committee (FOMC) meets. A calm weekend between the United States and Iran helped lift futures on Sunday night, and early Monday WTI crude was around $79 a barrel. That price is the backdrop for Fed Chair Kevin Warsh and the other eleven voting members as they decide on interest rates on Wednesday.
The week will stay busy. Retail sales numbers are due on Wednesday morning, right before the two‑day FOMC session. It is also an options‑expiration week, and a market holiday on Friday will compress positioning.
A Friendly Start for Chair Warsh
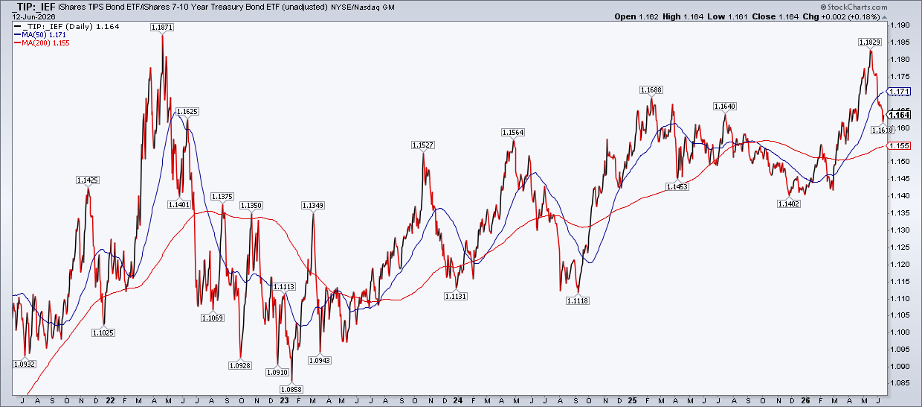
Chair Warsh has not faced the harsh market tests that new Fed leaders sometimes see. The TIP:IEF inflation gauge has fallen back about half of its rise from November 2025 to May 2026, showing that investors are less worried about rising prices. Since his confirmation, real yields have done most of the work, suggesting the Treasury market is focused more on growth than on inflation.
Oil Falls, Yields Follow
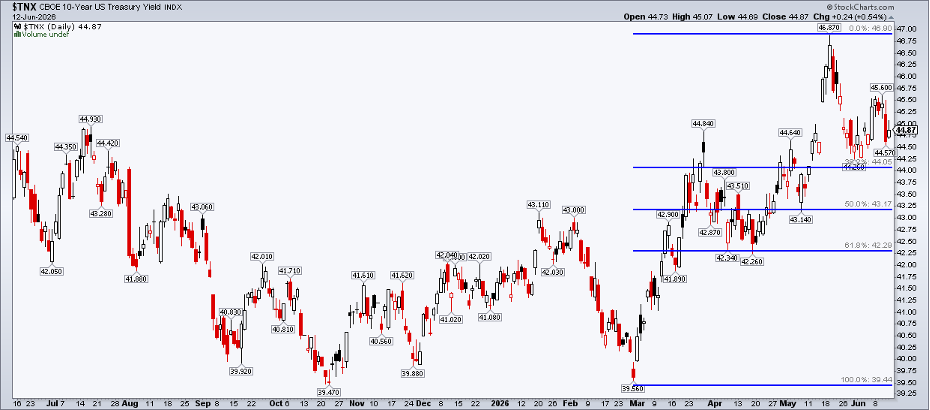
After news of a tentative peace framework between the U.S. and Iran, the 10‑year Treasury yield slipped below 4.45%, its lowest level in six weeks. If the truce holds and oil stays cheap, the Fed may choose to keep rates steady instead of raising them.
A steady‑rate stance would be good for sectors that like low yields, such as real‑estate and small‑cap value stocks.
One Inflation Gauge Cools
The iShares TIPS Bond ETF (TIP:IEF) shows investors easing their inflation worries, even though consumer‑price headlines remain strong. Technically, the ratio has fallen below its April 2022 peak. Support now sits around the 1.164–1.1688 range, and the 200‑day moving average is still rising, meaning the outlook isn’t fully cleared yet.
For the Fed to think about cutting rates again, the ratio would likely need to drop back toward its pre‑war low near 1.14.
Crude Oil: The Real Swing Vote
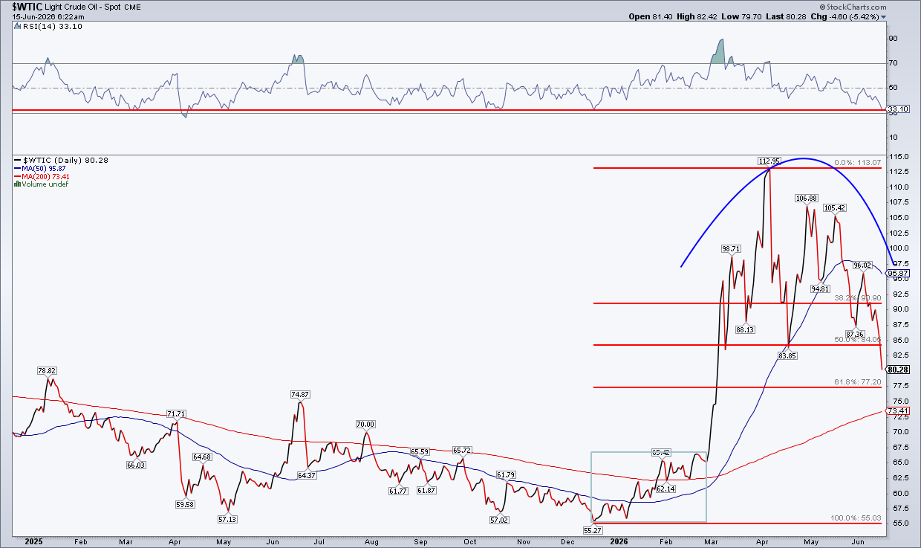
Oil remains the key factor for the Fed. WTI topped $119 earlier this year, then closed at $112.95 on April 7. This week it fell below the $83.85 level and could slide toward the mid‑$60s. The 200‑day moving average sits near $75, which may act as the next battleground.
The old Wall Street saying, “Buy on the sound of cannons, sell on the sound of trumpets,” suggests taking some profit from stocks and maybe buying the dip in oil. Technically, the $84‑$87 zone could become a short‑term ceiling as the RSI nears its yearly low.
A Possible Goldilocks Setup?
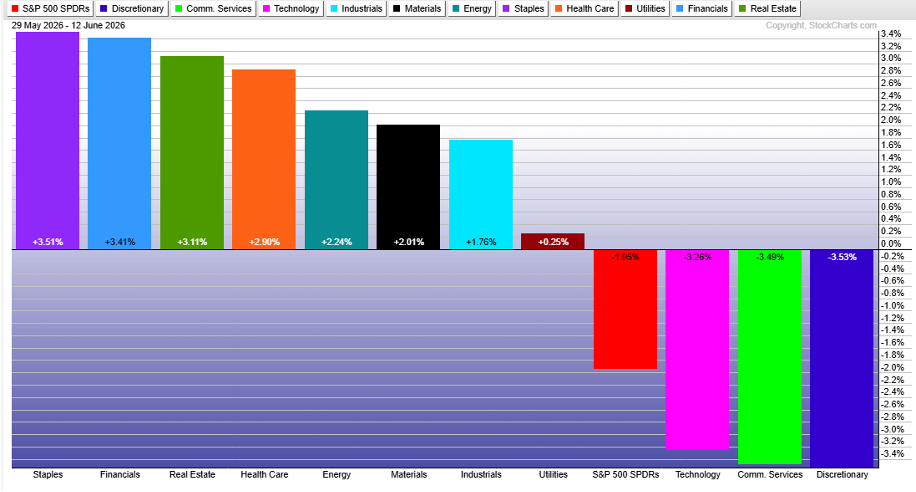
Before the Fed started holding press conferences, analysts focused on three things: growth, inflation, and guidance. The market now prices U.S. real‑GDP growth at about 2%, while timely indicators hint at a 3% real expansion. Sector performance in the S&P 500 this month shows early signs of stronger growth.
Since June began, financials, materials, and industrials have led the market. Falling Treasury yields have also helped high‑dividend consumer‑staples and real‑estate stocks. Meanwhile, tech, communication services, and consumer‑discretionary sectors have lagged.
Looking at these trends, the current stagflation worry could shift toward a “Goldilocks” environment—moderate growth with inflation under control.
Will the Dot Plot Change Under Warsh?
The Fed’s upcoming meeting will include the quarterly Summary of Economic Projections, known as the dot plot. Chair Warsh has not been a fan of these forecasts, so many investors may focus more on the Fed’s statement than on the dot plot itself.
The Bottom Line
Price action will tell the story first. Keep an eye on the 2‑year and 10‑year yields, the TIP:IEF ratio, and how cyclical industries perform. Geopolitical risks are hard to predict, and counting on lasting peace in the Middle East is risky. For now, lower oil prices and softer Treasury rates give Chair Warsh a softer landing as he steps into his first week as Fed chair.
Disclaimer: This article is for educational purposes only and does not constitute financial advice. Consult a qualified professional before making any investment decisions.
Source: Materials provided by https://articles.stockcharts.com.Note: Content may be edited for style and length.