

Traders who watch how many stocks stay above their moving averages can spot big shifts in market participation. This report looks at the recent jump in healthcare breadth and examines the XLV exchange‑traded fund.
Long‑Term Strength Improves for Healthcare
We compare the share of stocks above their 200‑day exponential moving average (EMA) for each sector with the S&P 500. A higher percentage than the benchmark means the sector has more stocks in a long‑term uptrend.
Energy, REITs, Technology, Industrials, Materials, and Utilities all sit above the S&P 500. Healthcare, Communication Services, Finance, Consumer Discretionary, and Consumer Staples sit below, showing relative weakness.
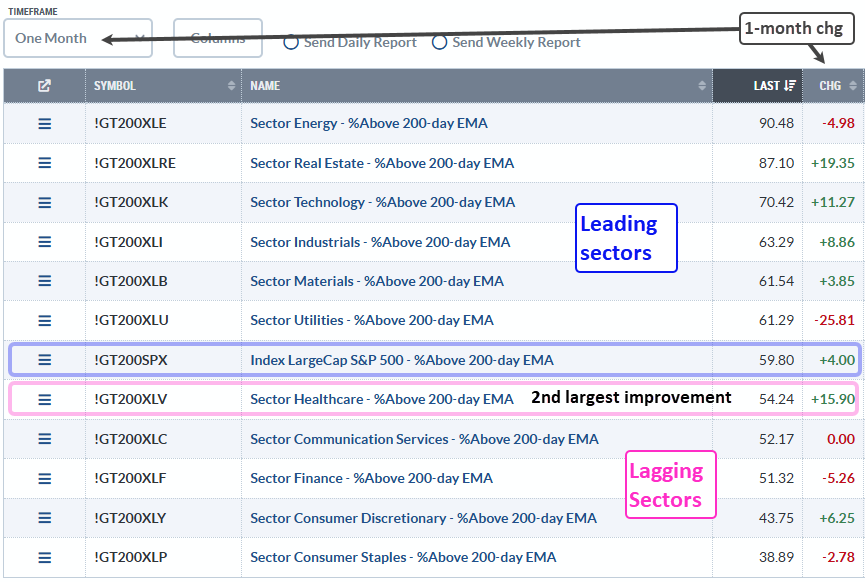
Even though Healthcare is in the lower half, its XLV %Above 200‑day EMA rose sharply this month, jumping 15.9 points—from 38.34 % to 54.24 %. That is the second‑best improvement among all sectors, indicating a strong move.
Mid‑Term Momentum Accelerates
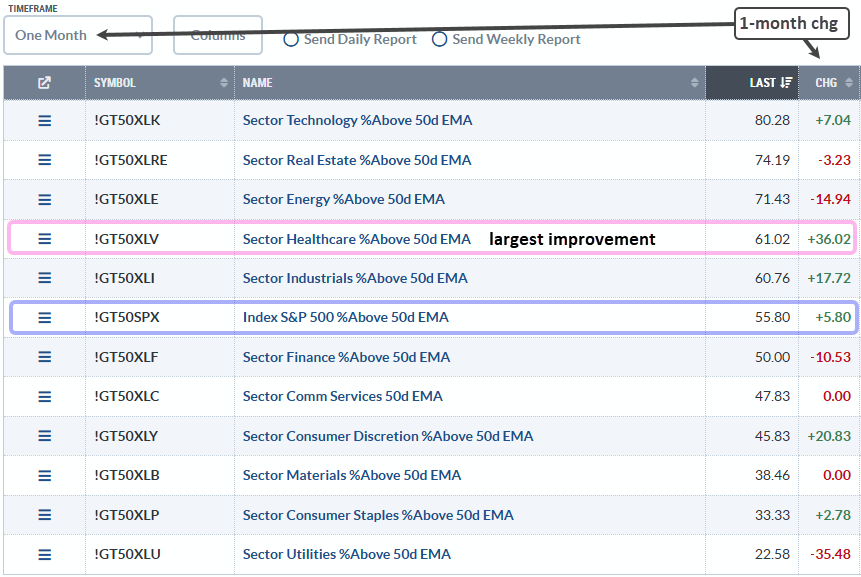
Looking at the 50‑day EMA, a medium‑term trend line, healthcare outperforms the S&P 500. About 61 % of healthcare stocks sit above the 50‑day EMA, versus 56 % for the broader market. In just one month that figure more than doubled, rising from roughly 25 % to 61 %.
XLV Finds Support and Breaks Out
After climbing about 25 % from August to early January, XLV fell sharply in March, dropping from 160 to 144. The drop landed near the 50 % retracement zone—an area traders watch for possible reversal.
Retracement zones are drawn using Fibonacci levels (38.2 %‑61.8 %) or the classic Dow rule of a one‑to‑two‑third pullback. The 25 % rise represents two steps forward; the move back to the 142‑144 range is roughly one step back, matching a 50 % pullback.
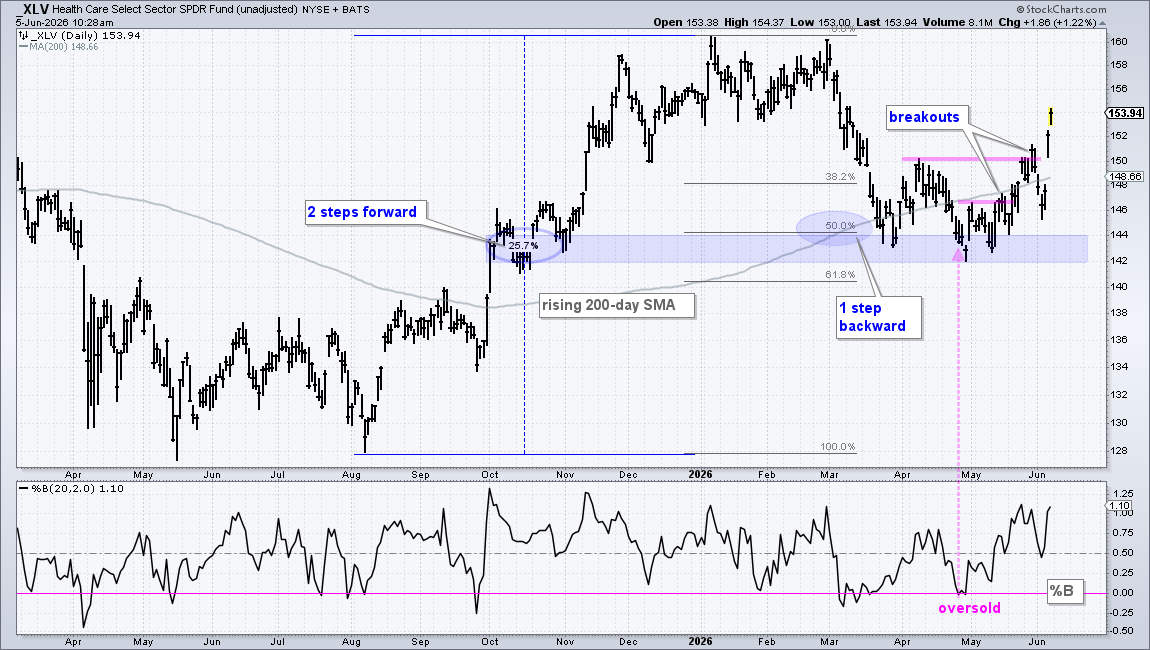
The ETF also faced a rising 200‑day simple moving average from late March to early June, which acted like a cushion during the pullback. In late April, the %B indicator fell below zero, showing the price closed under the lower Bollinger Band—an oversold signal that often leads to a bounce.
Support formed around 142‑144 during March‑May. When the price broke above that zone in late May, XLV surged to 152, confirming the end of the correction and the start of a new uptrend. A close below 142 would suggest a re‑evaluation.
Source: Materials provided by https://articles.stockcharts.com.Note: Content may be edited for style and length.