


Even after a rough day on Thursday, most investors still prefer taking risks. Early in the session, the S&P 500 and Nasdaq hit record highs, but later oil prices rose and the main indexes closed lower.
One day does not change the overall direction of the market. The trend is still upward, especially for the Nasdaq, where the Bullish Percent Index shows strong buying pressure. The Dow and the Transport Index are also holding up, while the S&P 500 is moving sideways.
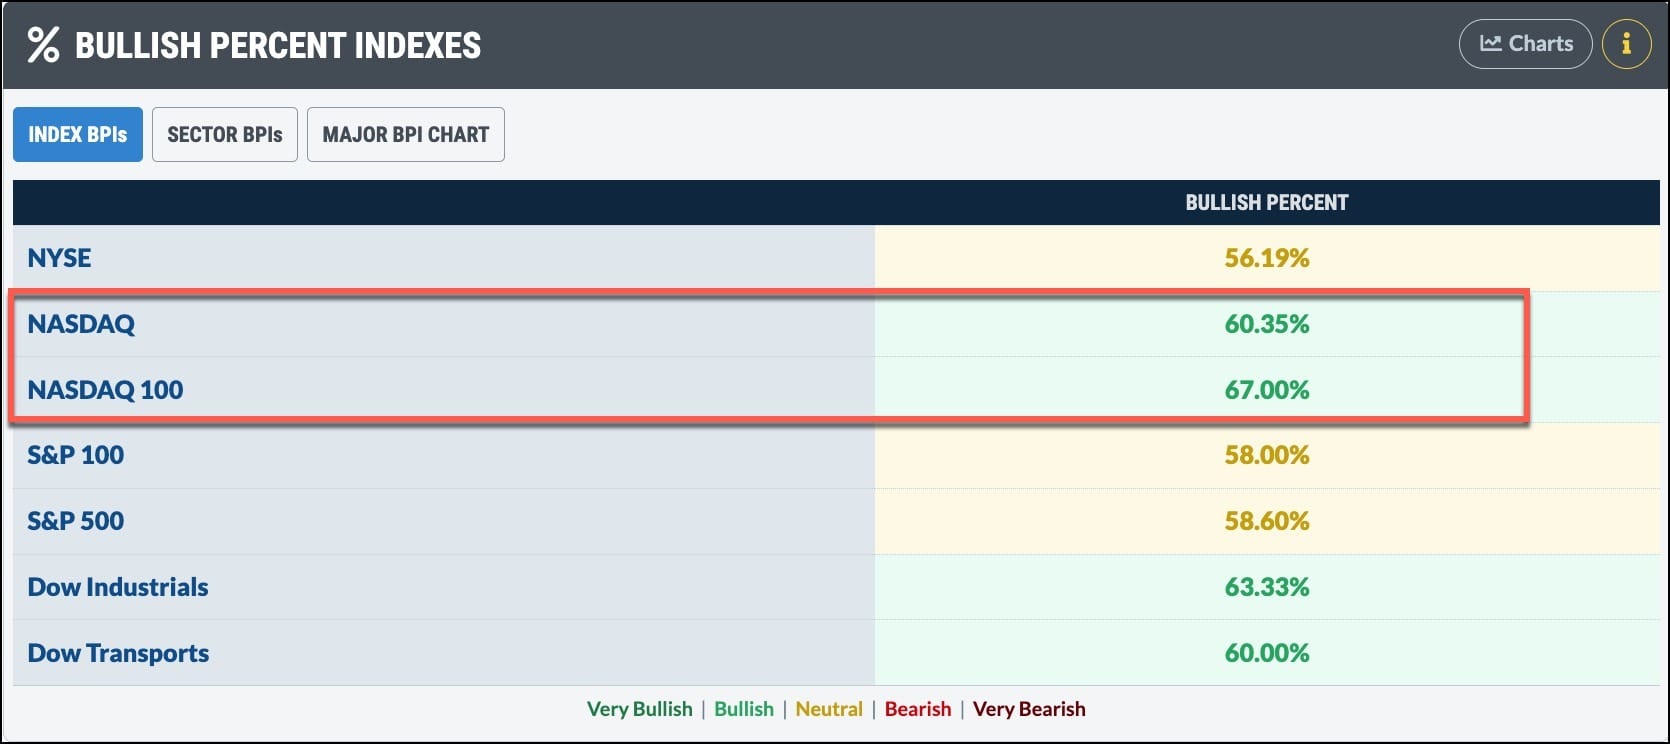
When we look at the market summary, more stocks are going up than down. Growth sectors are beating defensive ones, and overall sentiment is more positive than it was in March.
Early Warning Signs
Company earnings are solid, but rising oil prices could start to hurt shoppers.
Both McDonald’s and Whirlpool reported earnings that beat expectations, yet their outlook hinted that consumers might be tightening their belts.
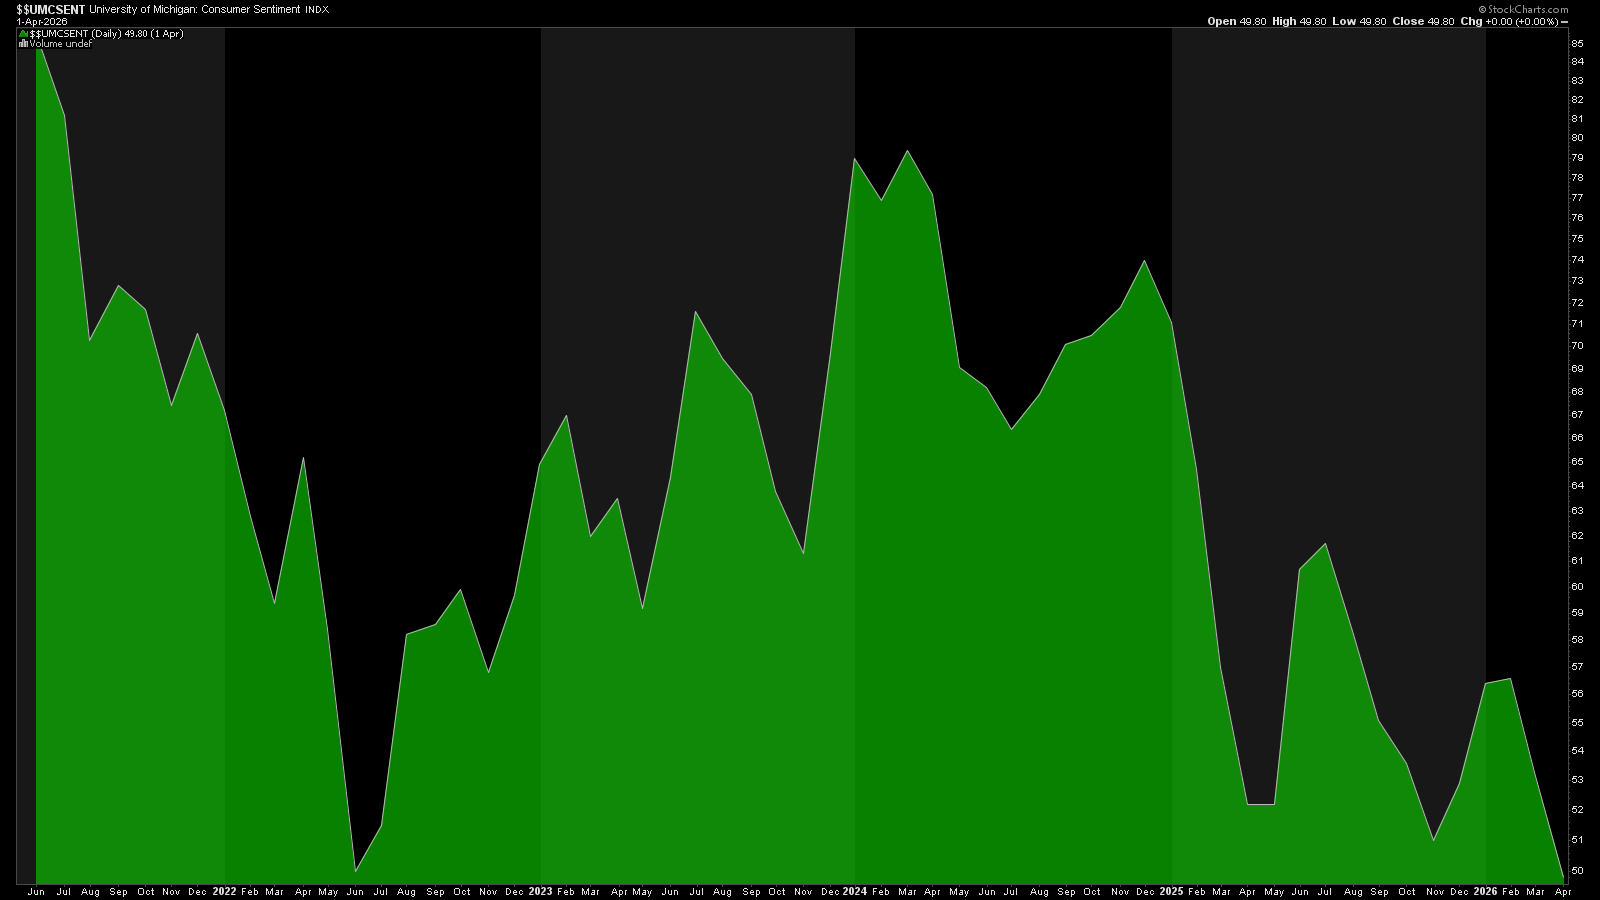
We do not see a clear drop in consumer confidence on the charts yet. However, the non‑farm payroll report due on Friday will tell us how strong the labor market is. A strong labor market usually means people keep spending, which helps the economy.
The University of Michigan Consumer Sentiment Index measures how confident Americans feel about the economy. The three‑year chart shows a dip in April, pressured by the Iran‑U.S. conflict and higher oil prices.
The Business Cycle
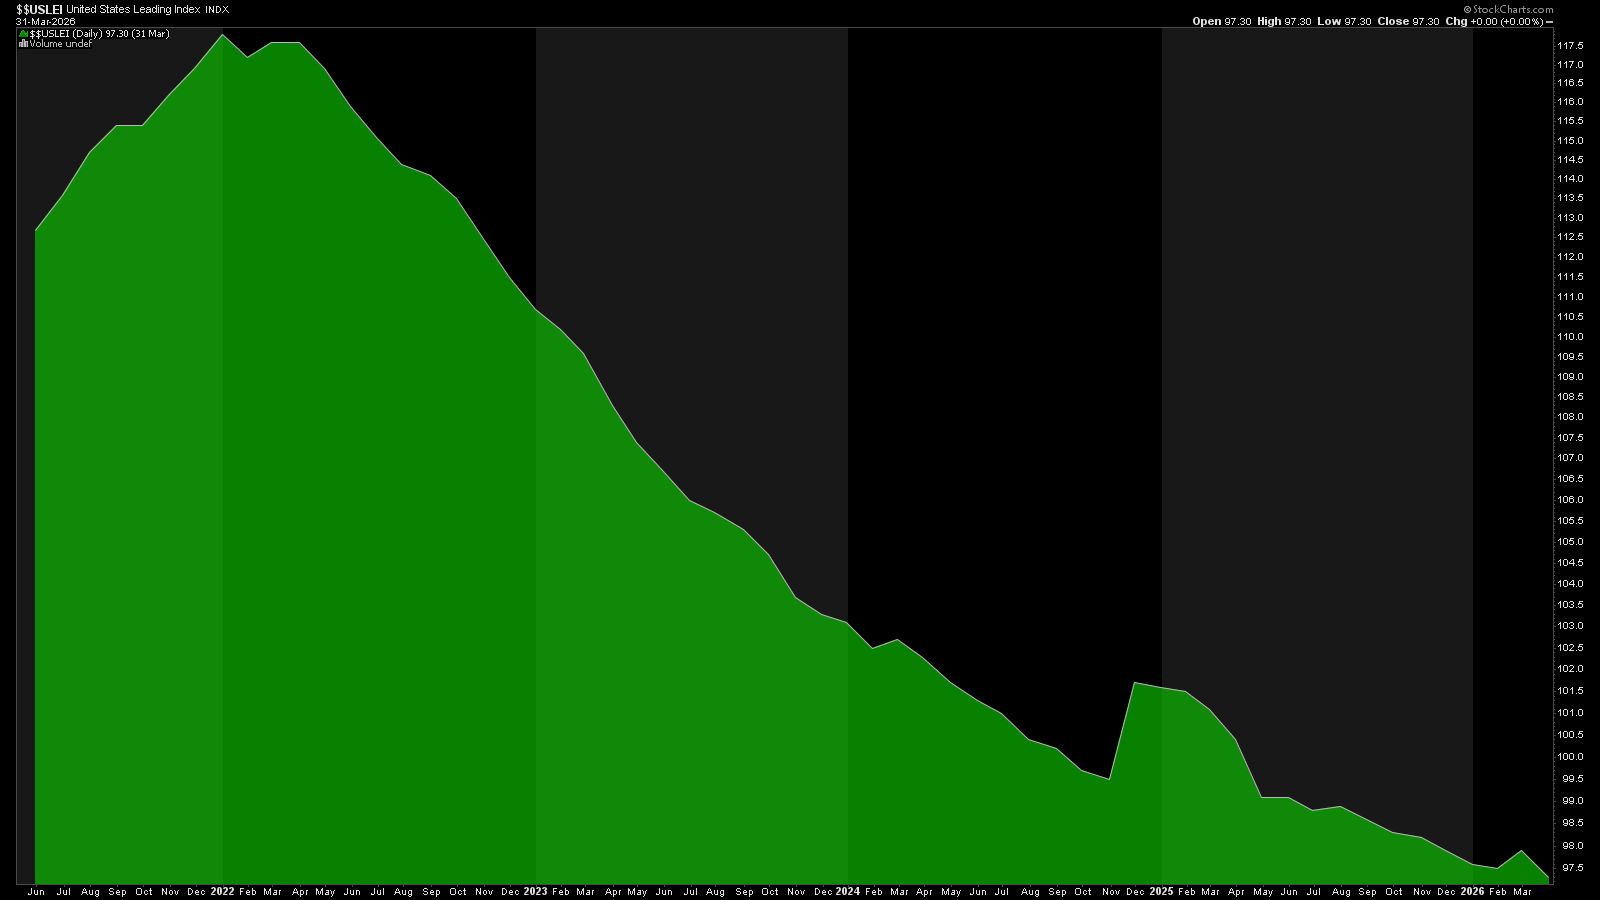
The United States Leading Index looks at several parts of the economy, such as manufacturing hours, jobless claims, new orders, building permits, and stock prices. It tries to warn us about upcoming peaks or valleys.
In the five‑year chart, the index dropped in March, suggesting that some parts of the economy may be slowing. There were brief rebounds in October 2024 and February 2026, but the overall line has been lower since 2022. Despite this, the economy is still growing and the market stays bullish.
AAII Survey
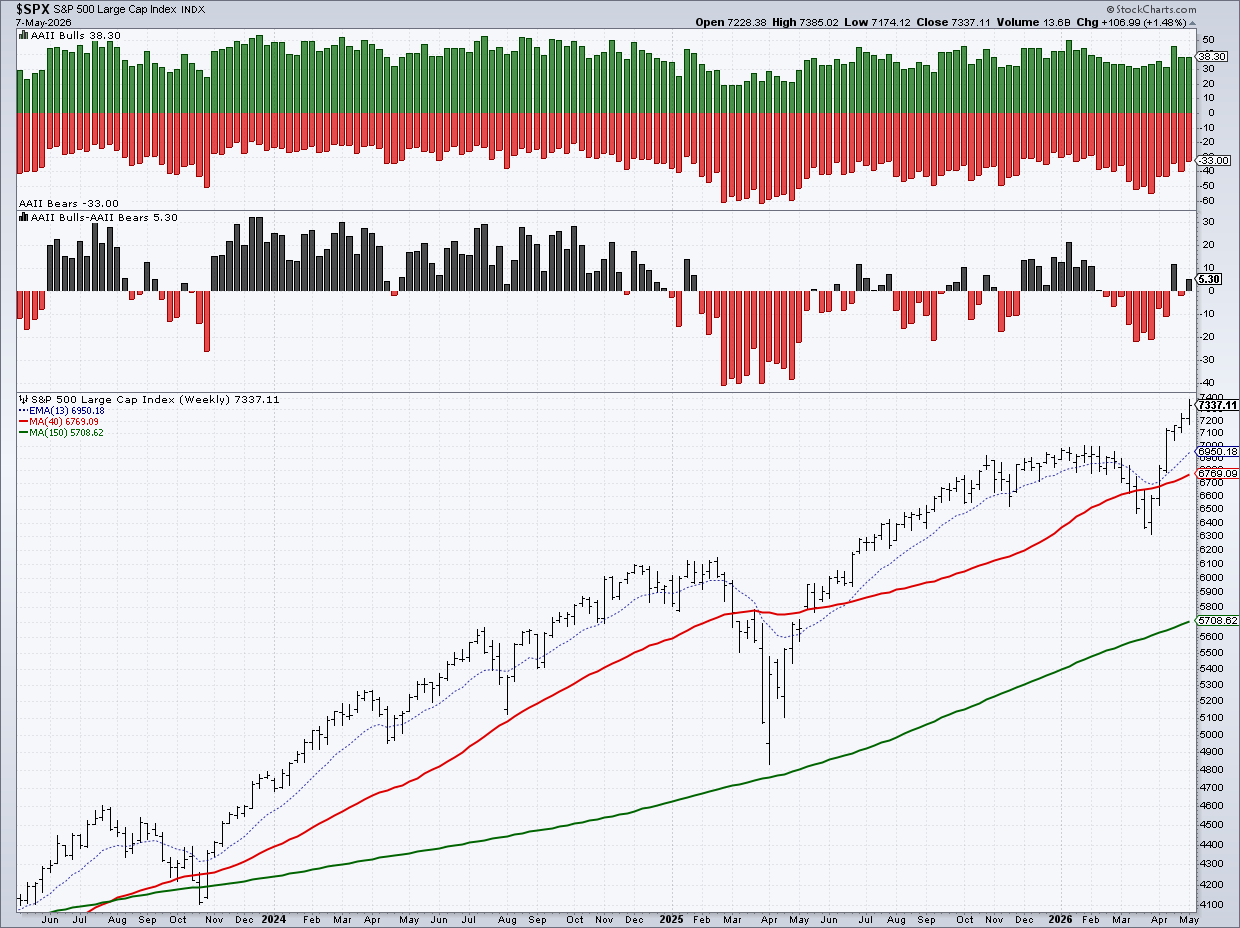
The AAII Bulls‑Bears chart shows that bullish sentiment is just a bit higher than bearish sentiment, matching the S&P 500’s steady rise.
Investor Fear
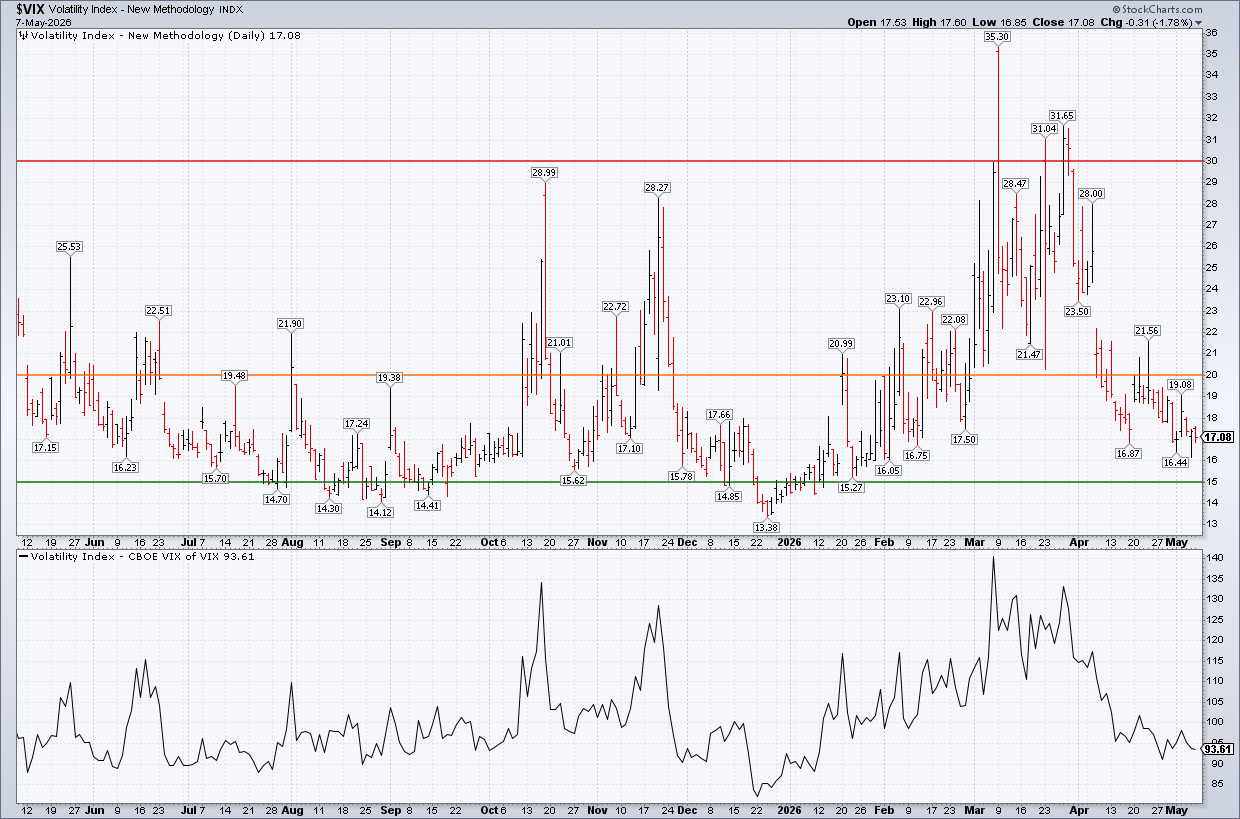
The Cboe Volatility Index (VIX) sits around 17, indicating that investors are relatively calm. The “VIX of VIX” also stays low, reinforcing this complacency.
The Bottom Line
Overall, the stock market stays strong thanks to solid corporate earnings, higher capital spending, and rising GDP. At the same time, we should keep an eye on weakening consumer confidence and softer economic data.
The jobs report on Friday could be a key test. A weaker number might cause some selling, while good news from the Middle East could keep investors focused on the rally.
If the payroll numbers are strong and geopolitics stay calm, the risk‑on rally could last longer.
Disclaimer: This content is for educational purposes only and does not constitute financial advice. Always consider your own financial situation or consult a professional before making decisions.
Source: Materials provided by https://articles.stockcharts.com.Note: Content may be edited for style and length.