


The S&P 500 has climbed a lot since the low on March 30. Some people worry, but the data tells a more balanced story.
Recent headlines say the rise is mostly because a few big tech names are doing well. A market‑breadth tool from Goldman Sachs showed its weakest reading since late 2023.
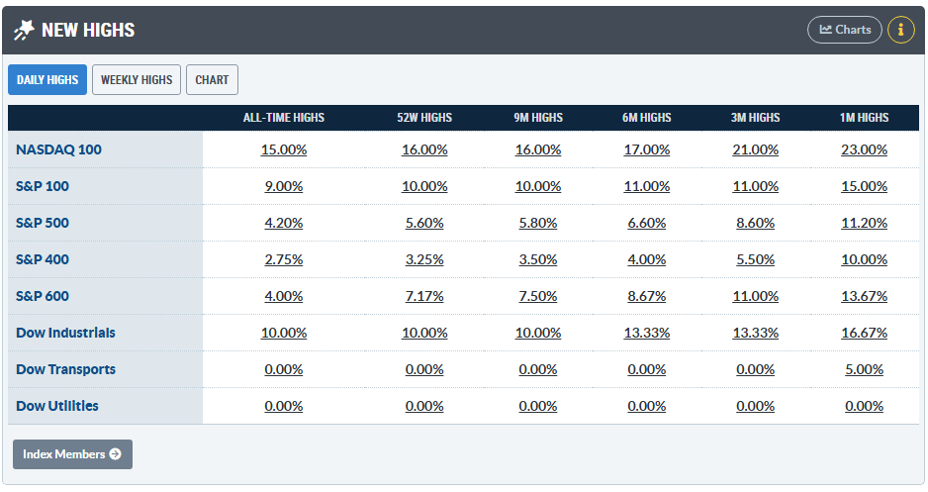
If you look at the “New Highs” box on StockCharts, only about 5.6 % of S&P 500 stocks closed at a 52‑week high last week, even though the main indexes hit records.
What About the “AI 11”?
A group of 11 AI‑related stocks, called the “AI 11”, includes chip makers like Intel, SanDisk and Micron as well as overseas firms such as SK Hynix and Samsung. They helped lift the market, but many other stocks are also joining the rally.
Average Stocks Are Holding Up
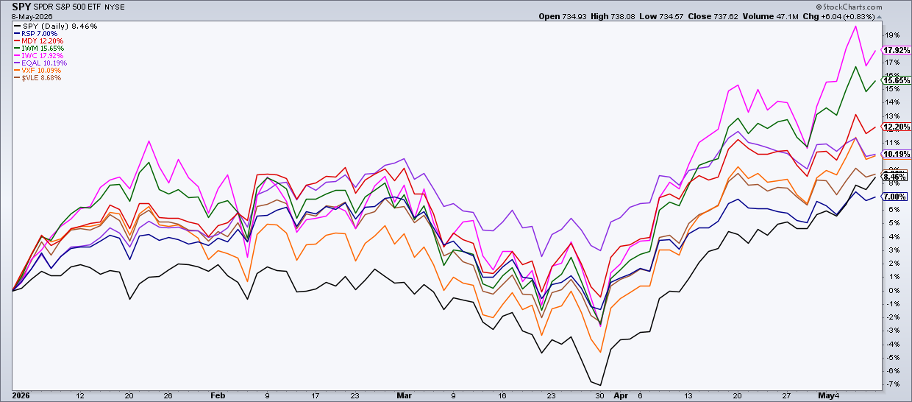
By early May the S&P 500 ETF (SPY) was up almost 9 % with dividends. A broader index, the Value Line Arithmetic Index, was a little higher. The Vanguard Extended Market ETF (VXF), which tracks stocks outside the S&P 500, was up 10.1 %.
Other ETFs performed well too: the iShares Micro‑Cap ETF (IWC) rose 17.9 %, the Russell 2000 ETF (IWM) gained 15.7 %, and the SPDR MidCap 400 ETF (MDY) earned 12.2 %.
International Stocks Are Up Too
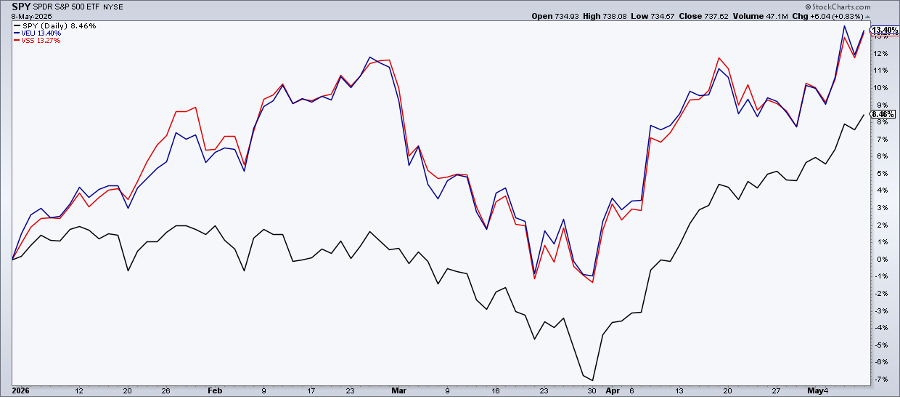
Overseas markets are climbing as well. The Vanguard FTSE All‑World ex‑US ETF (VEU) hit a record close on May 8 and is up 13.4 % this year. Its small‑cap version (VSS) is up 13.3 %, beating the S&P 500.
Is Weak Breadth a Warning?
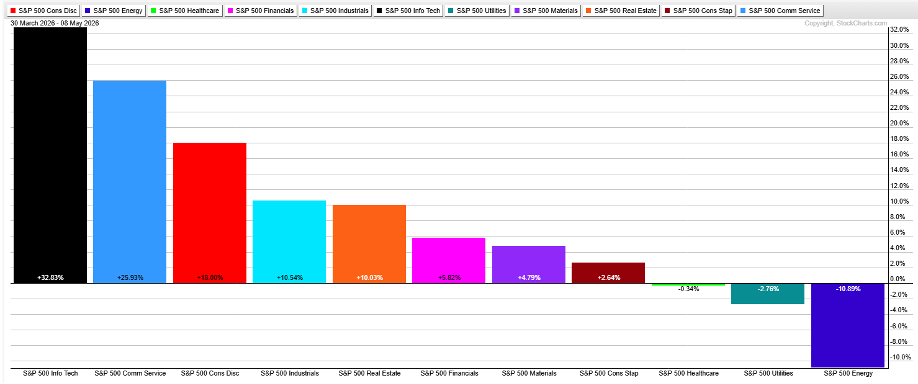
The drop in breadth numbers may simply show a shift of money between sectors. Since last November, energy and material stocks have fallen while tech, communication services and consumer discretionary have risen.
Risk Appetite Looks Strong
Defensive sectors like utilities, health care and consumer staples are flat, meaning investors still prefer riskier stocks. Energy remains weak, and lower oil prices could help calm the market.
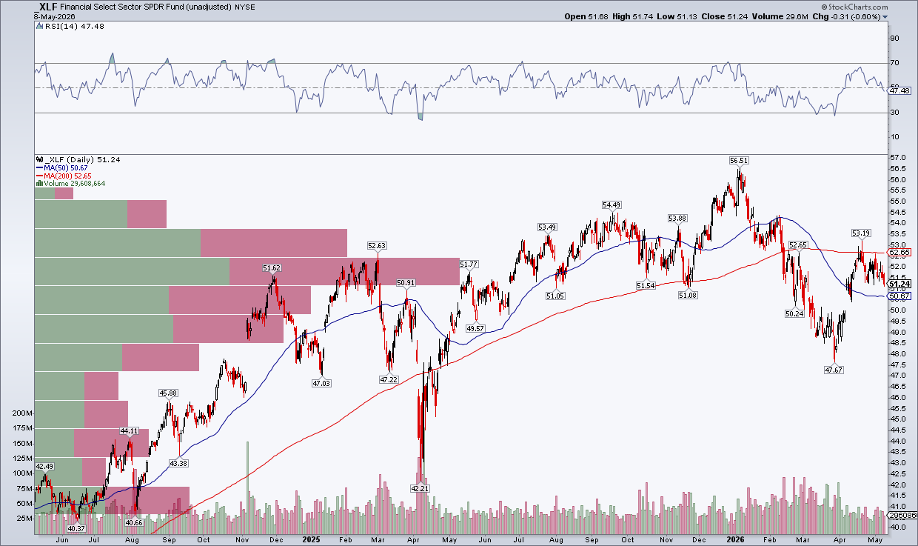
Financials Need a Boost
Financial stocks have lagged. The Financial Select Sector SPDR Fund (XLF) is down about 10 % from its January high and sits below its 200‑day moving average. A rebound here could lift market confidence.
Bottom Line
Breadth numbers can look scary, but many sub‑indexes are at record highs and are beating the S&P 500. Watch sector moves and financial stocks as the second half of the year unfolds.
Disclaimer: This article is for education only and is not financial advice.
Source: Materials provided by https://articles.stockcharts.com.Note: Content may be edited for style and length.