

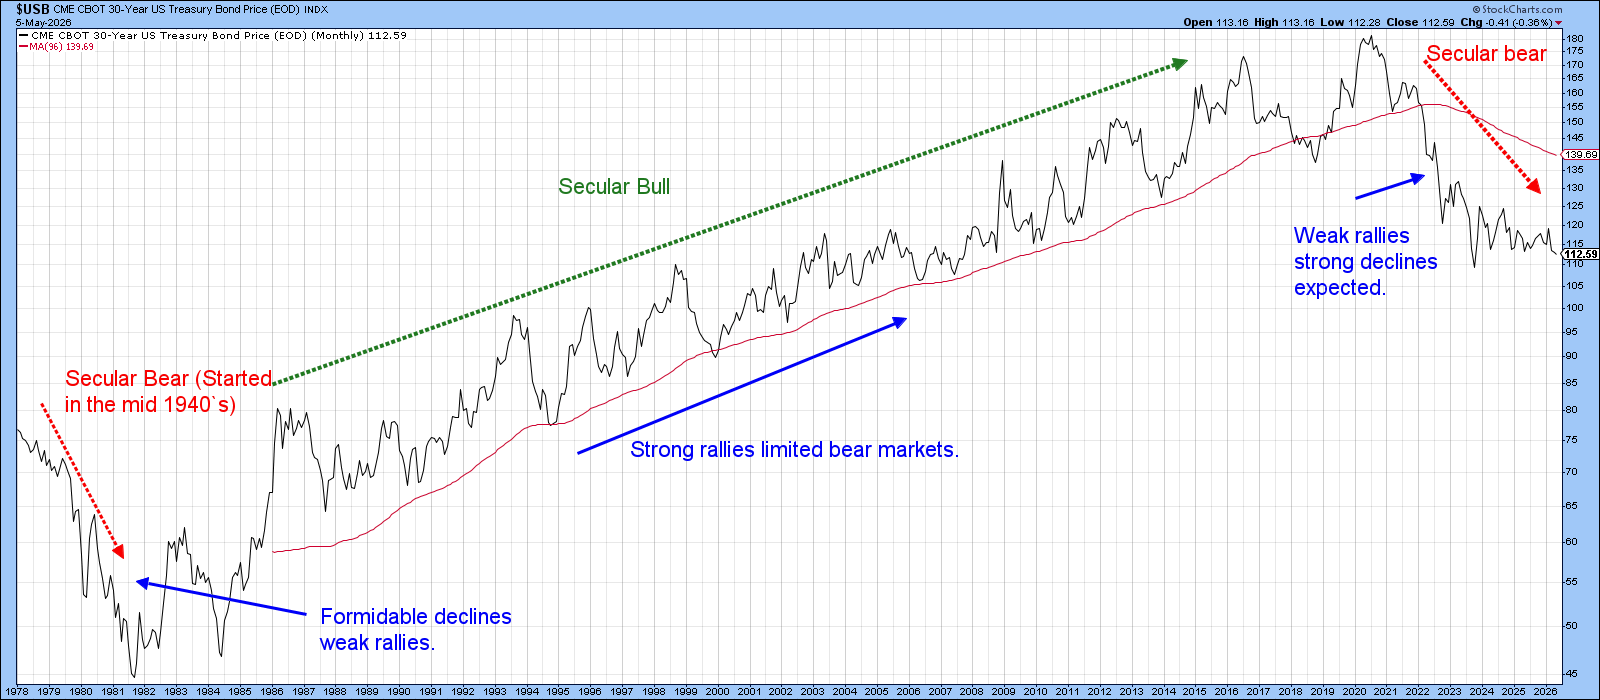
From the 1940s until 1981, bond prices fell for many years. Then they rose steadily until 2020. New analysis suggests that a fresh, long‑term decline in bond prices may have started after 2020, which means yields are likely to keep climbing.
When a big trend changes, the smaller moves that follow are usually shorter and weaker. If yields are now on a permanent upward path, the short‑term peaks and valleys we saw from 1981‑2020 will become smaller and less lasting. Any short‑term rally in bonds should be viewed with caution.
Which tool should investors watch to spot a bond‑buying chance? Gold is a good clue because it reacts strongly to inflation expectations. High‑quality, almost risk‑free bonds hate inflation, since it reduces their buying power. They do well when prices stop rising or even fall. This opposite reaction creates a clear signal about inflation and deflation.
Chart 2 shows the ratio of spot gold to the 30‑year Treasury bond, along with a long‑term KST (Know Sure Thing) indicator. The vertical lines mark times when the KST gave a sell signal. Historically, those moments line up with important turns in the battle between inflation and deflation.
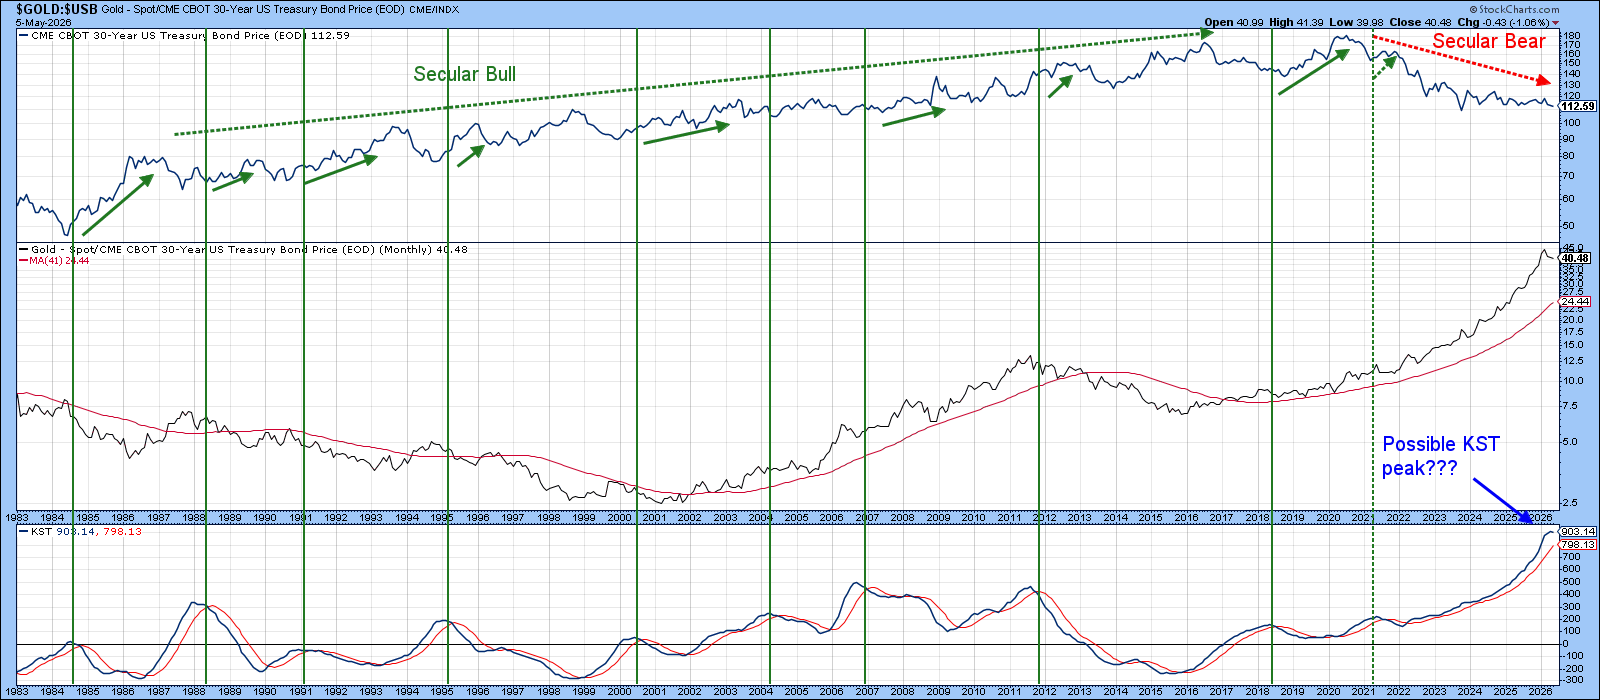
Sometimes gold’s momentum tops out, showing that inflation pressure is easing. That is good news for bonds that suffer when prices rise. In a world where bond rallies are expected to be short, these KST peaks still matter, but they are less powerful than before.
Right now the gold‑to‑bond ratio sits well above its 96‑month moving average, keeping its long‑term trend positive. The KST is still rising but has begun to lose steam, which is normal when an indicator sits at a record high and needs a pause to keep moving upward.
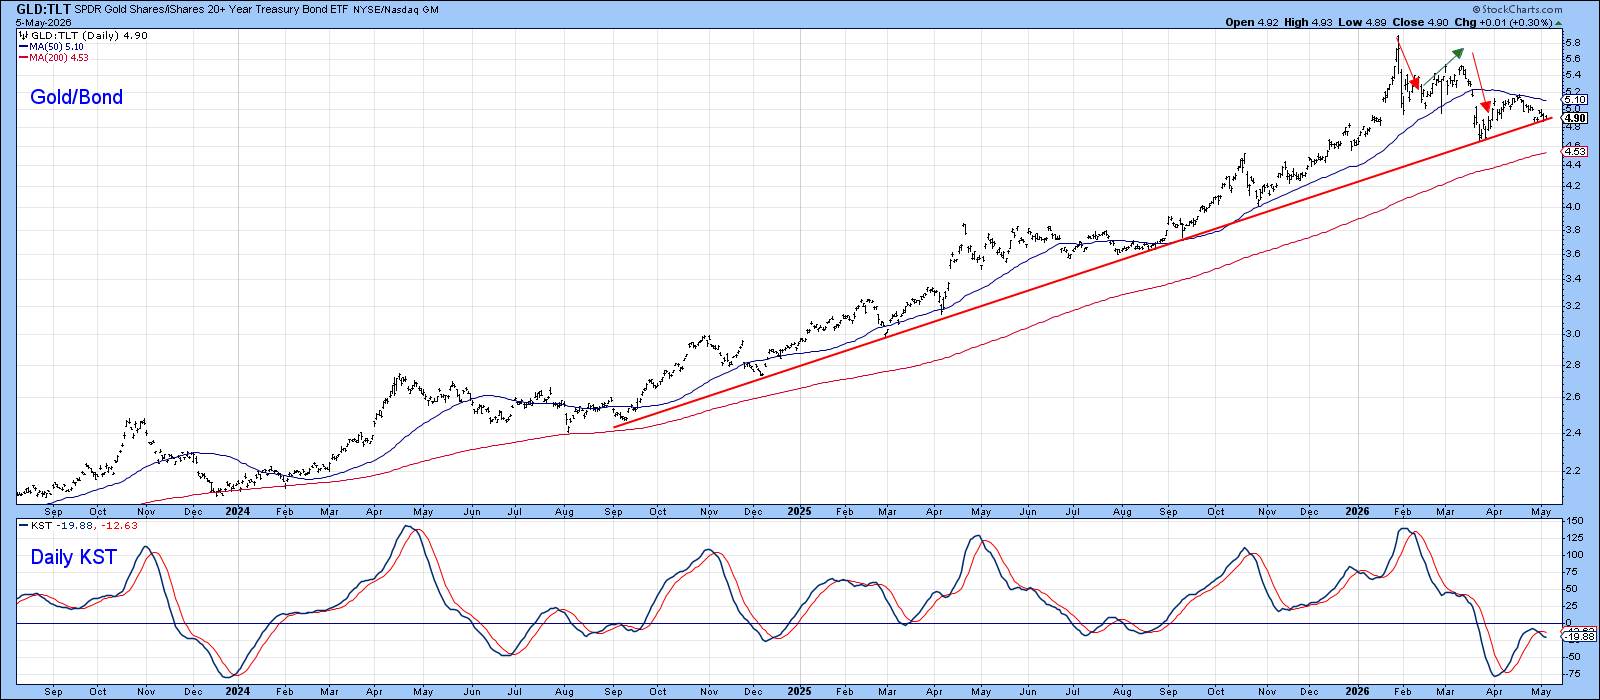
Chart 3 replaces the 30‑year Treasury with the iShares 20‑Year Treasury ETF (TLT). The ratio has slipped to a major up‑trend line that has acted as strong support in the past. Red and green arrows highlight a pattern of lower highs and lower lows. If the price breaks this line decisively, it could confirm a bearish view. For now, the support holds, and bears have not yet proved their case.
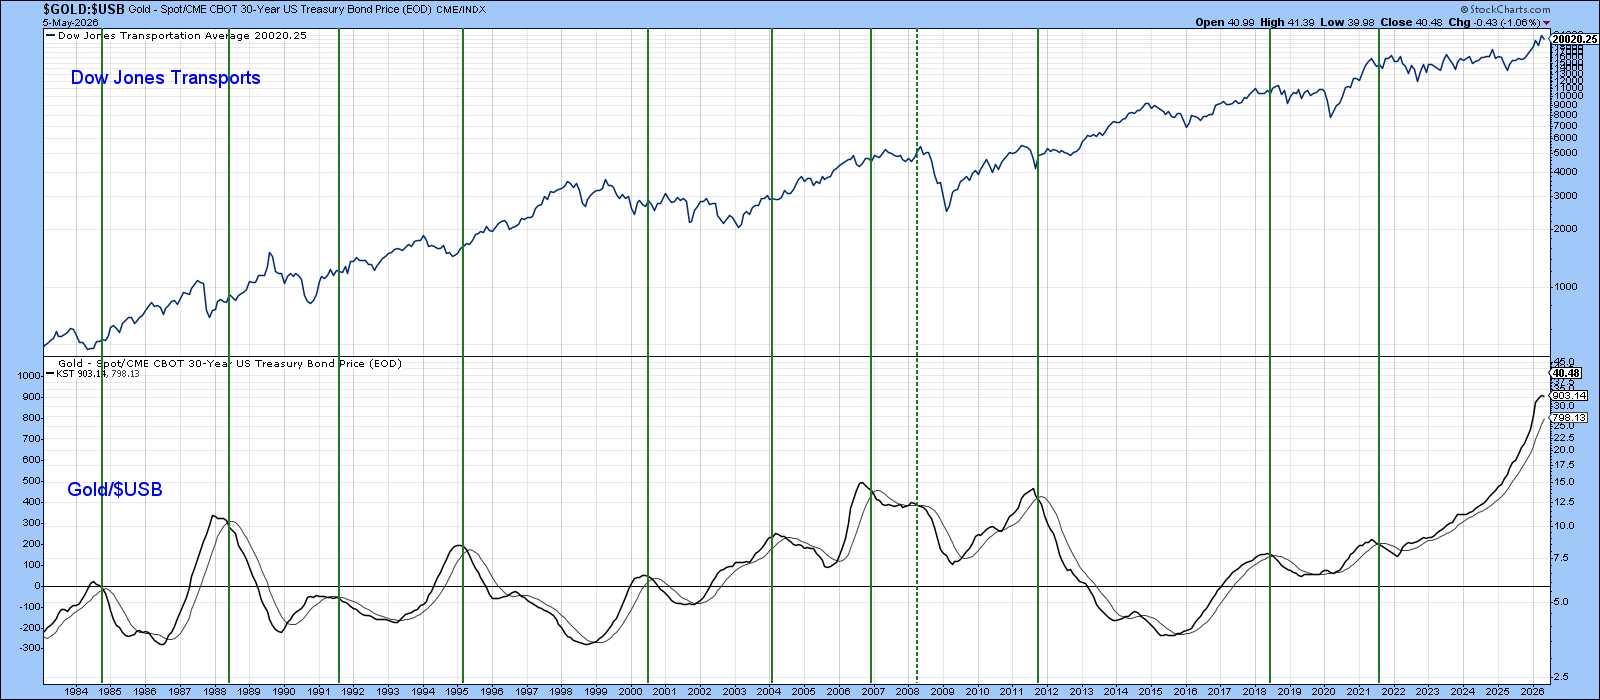
Gold, Bonds, and the Transport Sector
The gold‑bond relationship follows the business cycle. When inflation slows, transport companies often benefit because their costs drop. The Dow Jones Transportation Index (TRAN) tends to rise near the same points where the gold‑bond ratio’s KST peaks. This does not give an exact buy signal, but it shows that easing inflation can help cyclical industries.
Bottom Line
The gold‑bond signal is losing steam, and its long‑term KST is flattening. There isn’t enough evidence yet to say the main trend has turned. If the next move leans toward deflation, any bond rally should be seen as a short‑term tactical play, not a long‑lasting bull market.
Should 2020 mark the start of a new, long‑term decline in bond prices, any bounce will likely be weaker and shorter than the strong rallies of the 1981‑2020 era. A KST reversal could still offer a buying window, but it will not be the multi‑year surge investors grew used to.
Source: Materials provided by https://articles.stockcharts.com.Note: Content may be edited for style and length.