

Technology Climbs, Energy Holds Strong
Last week the S&P 500 moved a little higher. The list of the five best sectors stayed the same, but their order changed. Energy stayed at the top, while technology jumped from fourth to second place.
Materials fell to third and Industrials to fourth. Real Estate stayed fifth. The next sectors, in order, are Consumer Staples, Utilities, Communication Services, Consumer Discretionary, Financials, and Health Care.
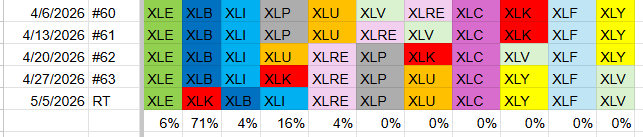
- Energy (XLE) – 6%
- Technology (XLK) – 71%*
- Materials (XLB) – 4%*
- Industrials (XLI) – 16%*
- Real Estate (XLRE) – 4%
- Consumer Staples (XLP)
- Utilities (XLU)
- Communication Services (XLC)
- Consumer Discretionary (XLY)
- Financials (XLF)
- Health Care (XLV)
Weekly Relative Rotation Graph
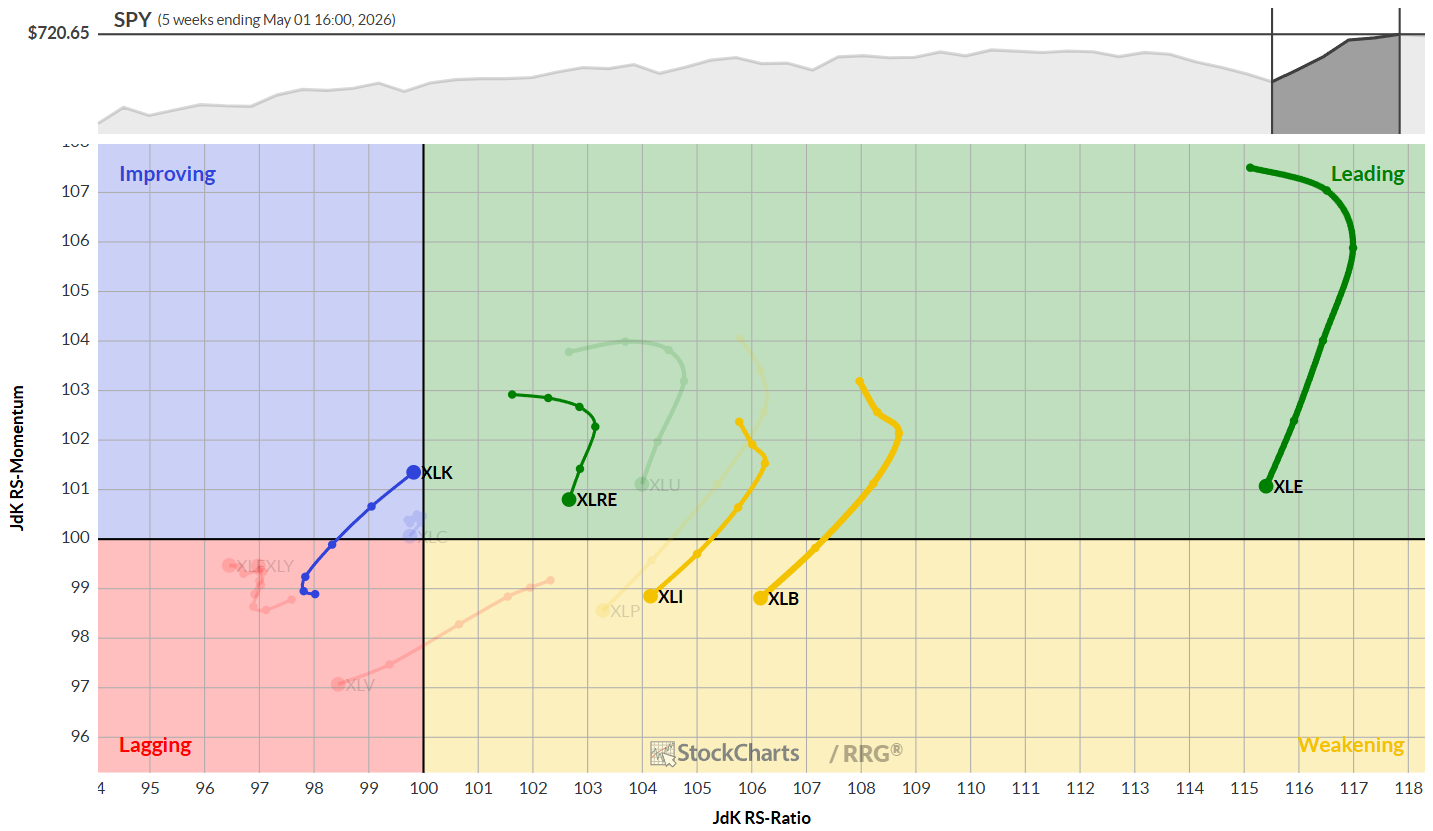
The weekly RRG still shows Energy, Materials, Industrials and Real Estate on the right side. This means they keep some strength even though their momentum is slipping.
Technology is the surprise. It moved close to the leading quadrant and finally crossed into it on Monday, May 4. The fast climb shows strong price growth.
Daily Relative Rotation Graph
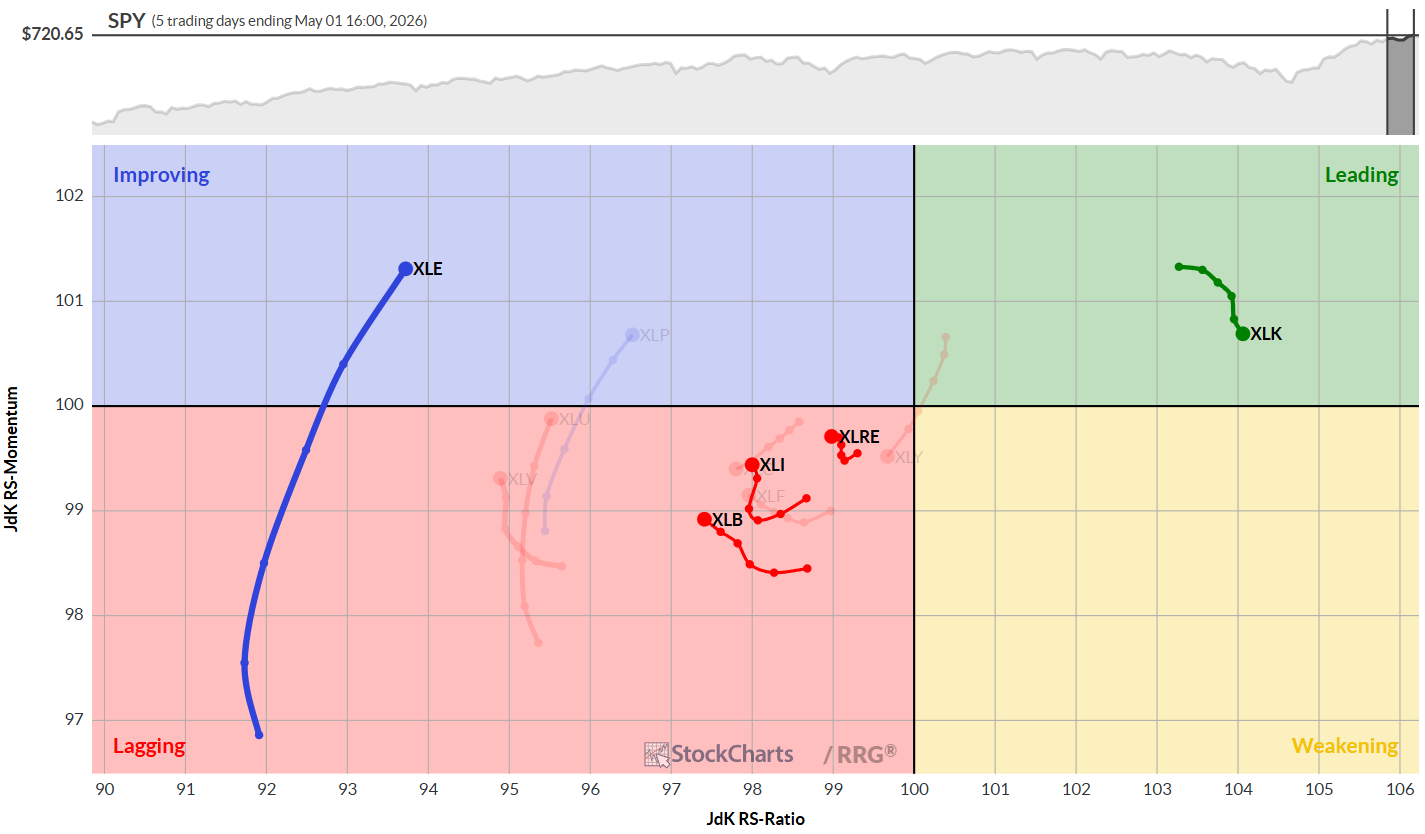
On the daily chart, Energy, Materials, Industrials and Real Estate are now on the left side, gaining a little momentum. Energy is already in the improving area, and the others are moving toward it.
Technology sits inside the leading quadrant after its quick rise, confirming its current strength.
Sector Snapshots
Energy
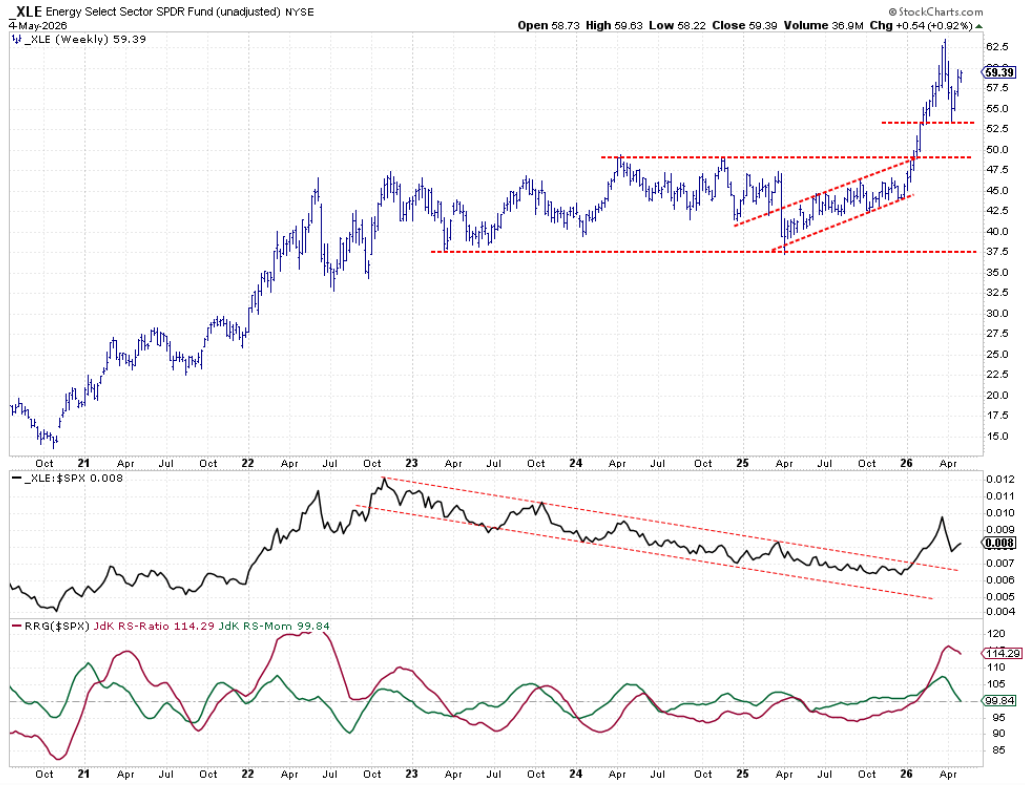
Energy bounced off a support level near 53 and set a higher low. The strength line is still pulling up, so the weekly RRG should level out soon.
Materials
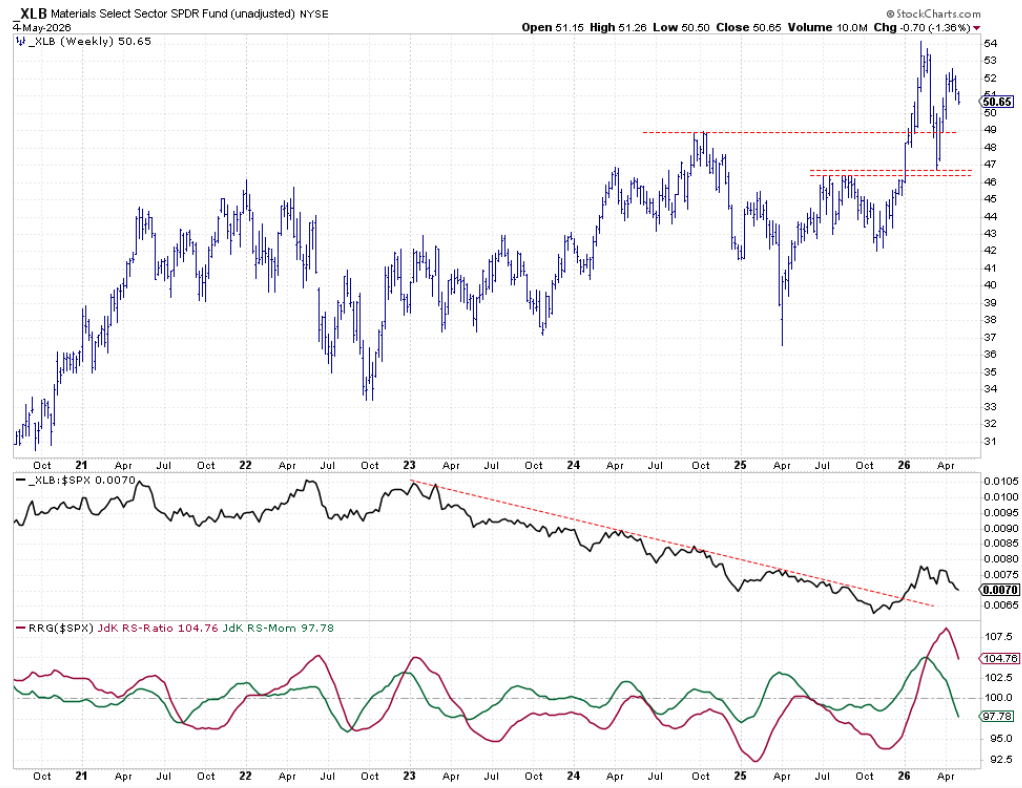
Materials rose from a low around 46.5 but then made a lower high. This created a small double‑top in the strength line, pushing the RRG lower and hinting at more weakness.
Technology
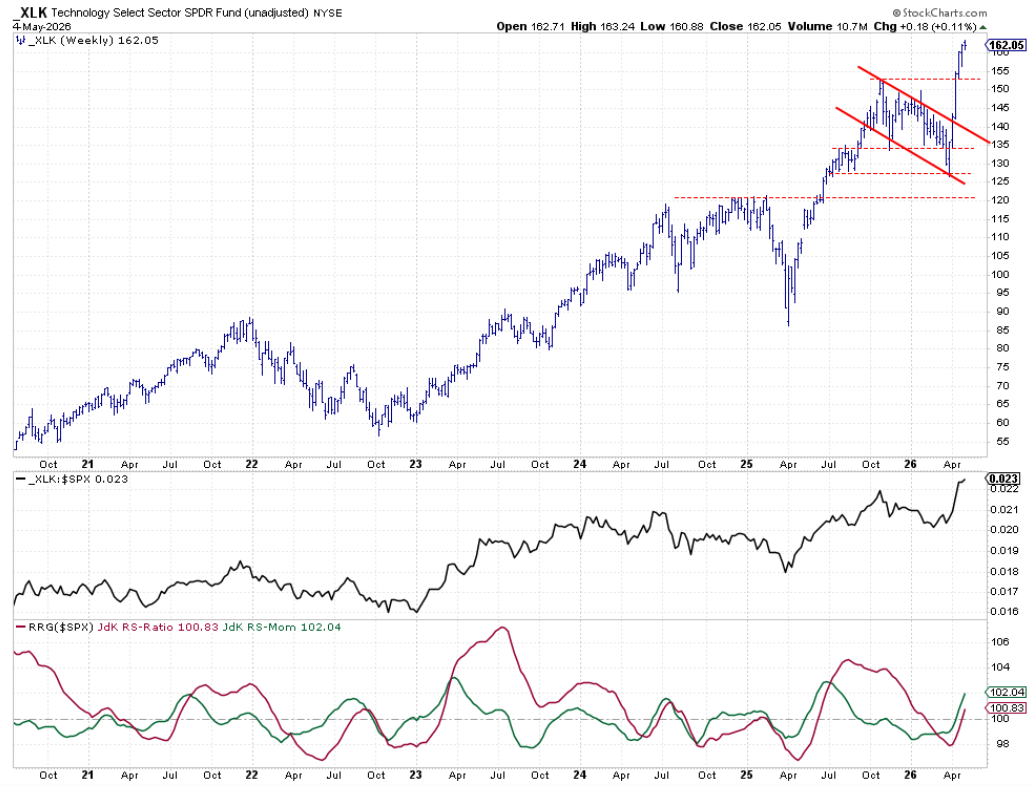
Technology kept climbing, hitting new all‑time highs. The strength line broke above its previous peak, and both RRG lines moved over 100, locking the sector in the leading quadrant.
Industrials
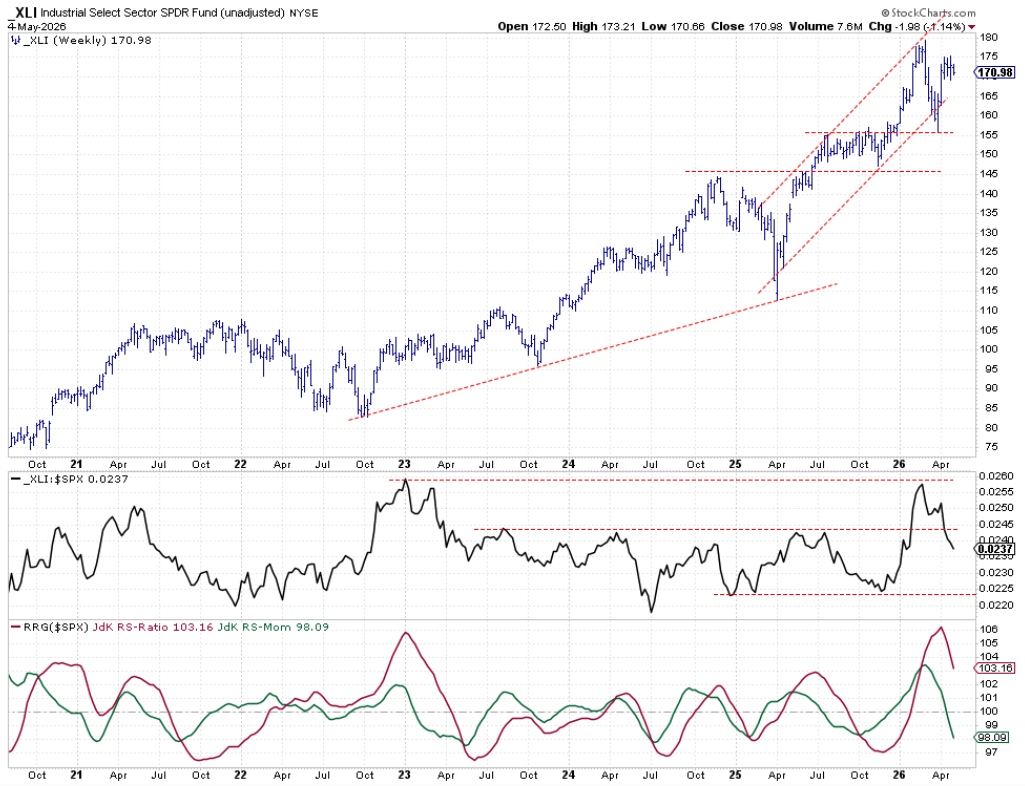
Industrials have moved sideways for several weeks. The strength line shows lower highs and lower lows, and the RRG is sliding toward the lagging area.
Real Estate
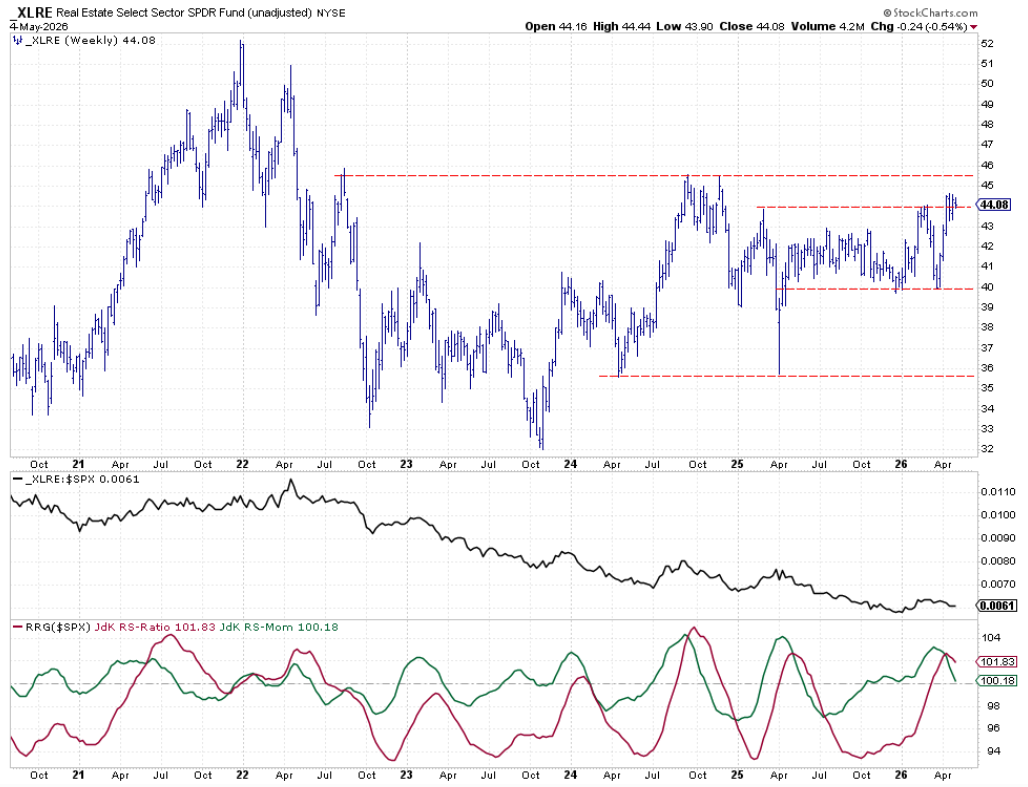
Real Estate stays steady above a new support level. There is no strong follow‑through yet, and the strength line is flat, pulling the RRG slightly down.
Portfolio Overview
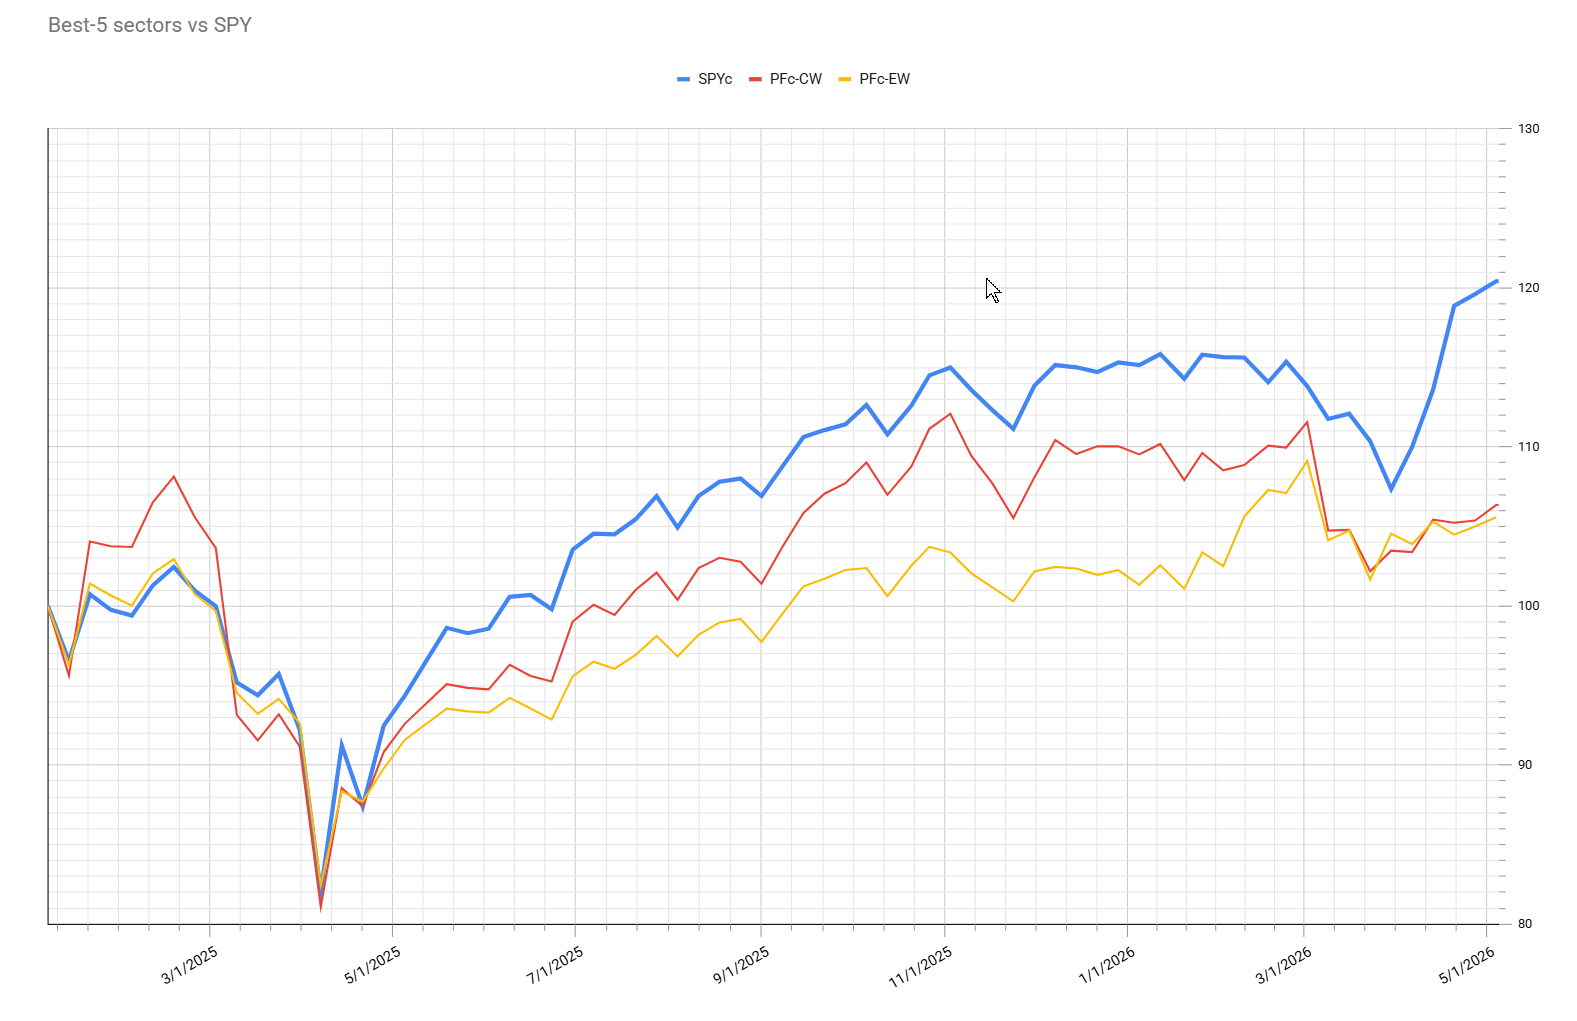
The portfolio mix stayed the same as last week. Technology makes up about 70% because the other top sectors are smaller.
Overall the portfolio is down roughly 14%. This style needs a clear, steady trend to win, and the market has been choppy for most of the year.
Source: Materials provided by https://articles.stockcharts.com.Note: Content may be edited for style and length.