

Tech Leads, Consumer Staples Rises
Travel delays made me late to write this, but here’s the update for the week ending May 22.
Energy stayed at the top of the list, followed by a powerful Technology sector. Materials kept the third spot. Consumer Staples jumped from sixth to fourth, pushing Industrials down to fifth and Real Estate to sixth.
In the lower half, Utilities held steady at seventh. Communication Services and Consumer Discretionary stayed at eighth and ninth. Healthcare moved up to tenth, while Financials fell to the bottom.
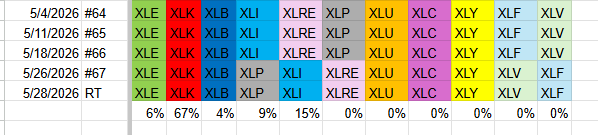
Because Consumer Staples now has a larger market value than Real Estate, Technology’s share of the portfolio fell from 71 % to 67 %.
Sector Weights
- Energy – XLE (6 %)
- Technology – XLK (67 %)
- Materials – XLB (4 %)
- Consumer Staples – XLP (9 %)
- Industrials – XLI (15 %)
- Real Estate – XLRE
- Utilities – XLU
- Communication Services – XLC
- Consumer Discretionary – XLY
- Health Care – XLV
- Financials – XLF
Weekly Relative Rotation Graph (RRG)
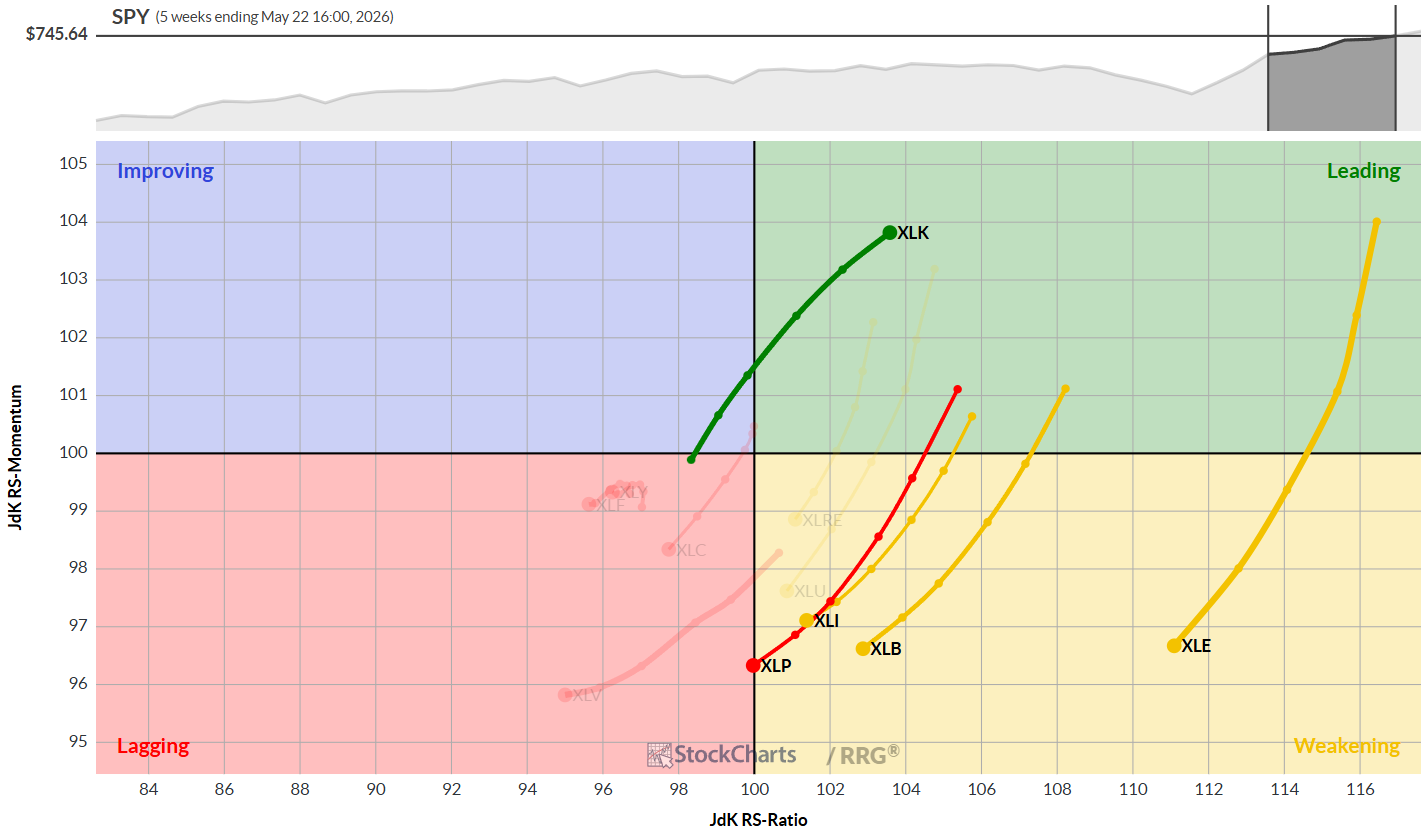
The weekly RRG shows Technology as the only sector in the leading quadrant, keeping a strong upward direction.
All other top‑five sectors sit in the weakening quadrant and point down, except Consumer Staples, which moved into the lagging quadrant. Energy still ranks highest by RS‑ratio.
Daily Relative Rotation Graph (RRG)
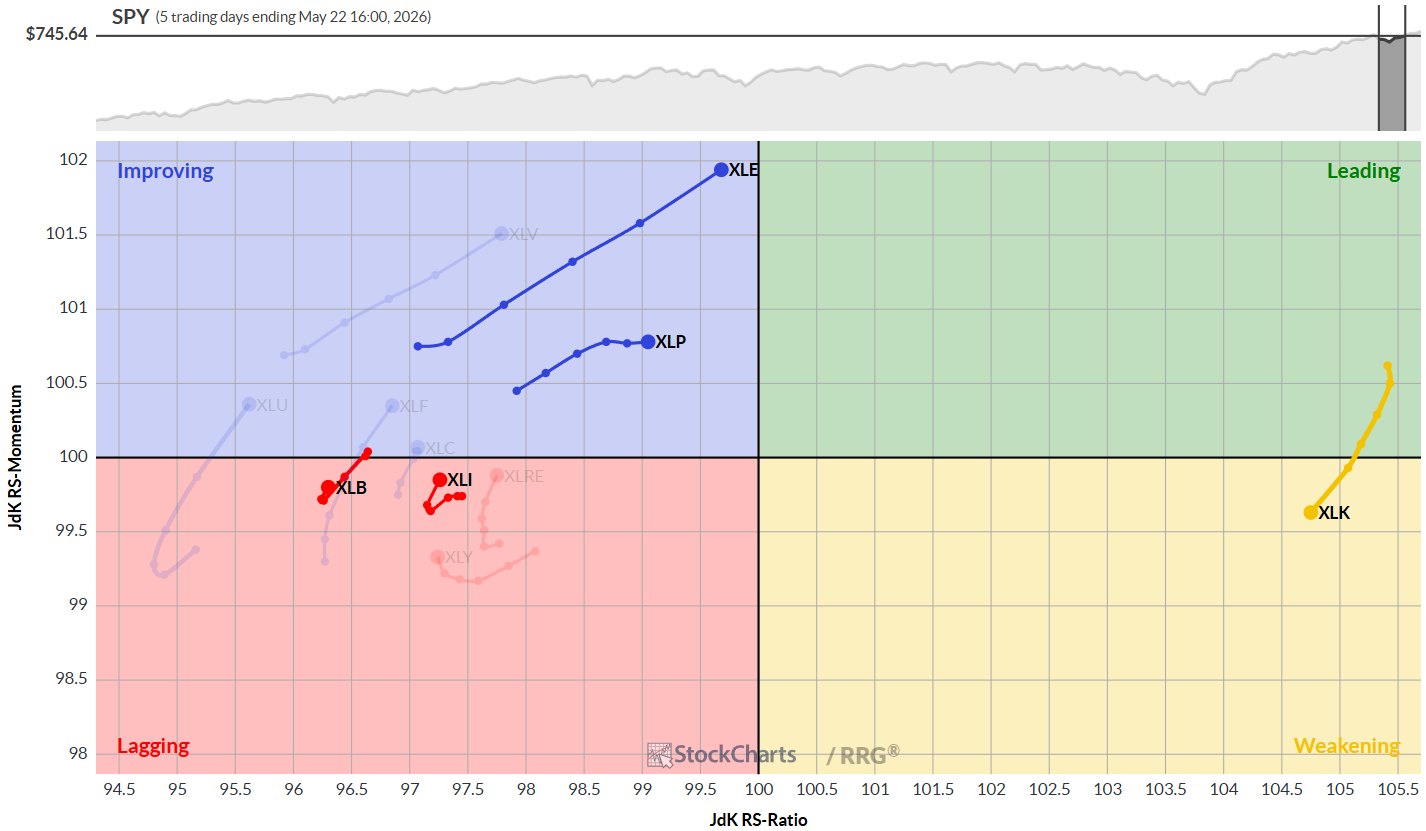
On a daily basis, Technology dominates the chart, sitting far to the right with the highest RS‑ratio. Energy and Consumer Staples sit in the improving quadrant, supporting their weekly strength. Materials and Industrials remain in the lagging quadrant, showing a steady downtrend that makes a quick reversal unlikely.
Sector Highlights
Energy
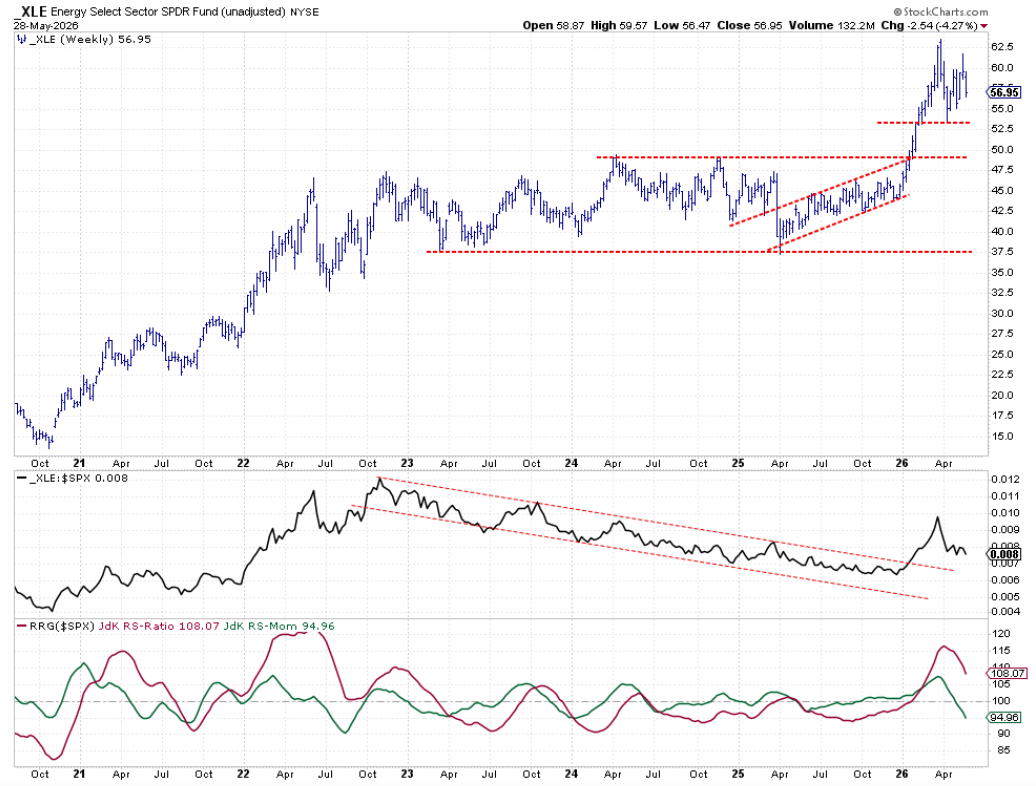
Energy’s price chart stays strong but looks like it’s entering a short‑term pause after breaking out of its recent range. Relative strength stays high, but a higher low would help keep the rally alive. Both RRG lines are slipping, yet the RS‑ratio stays elevated, leaving Energy in the weakening quadrant.
Technology
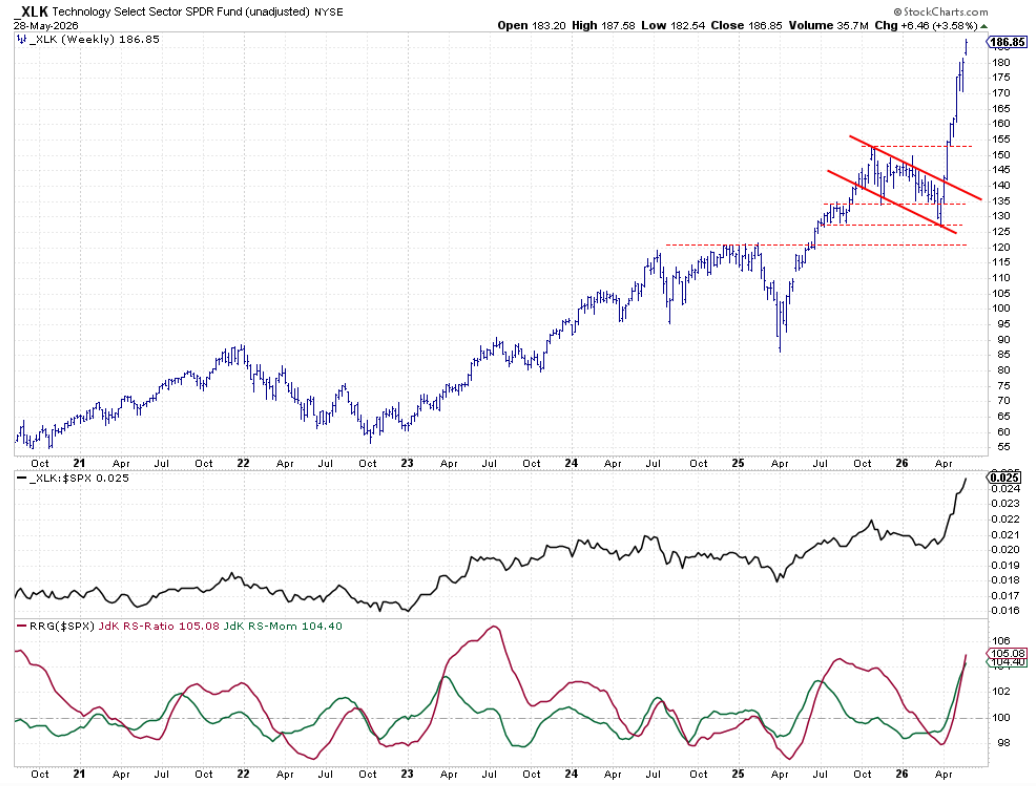
Technology continues its sharp climb. The rally feels fast, but there are no signs of weakness. Both price and relative strength keep moving higher, and the RRG lines rise steeply, showing no slowdown in sight.
Materials
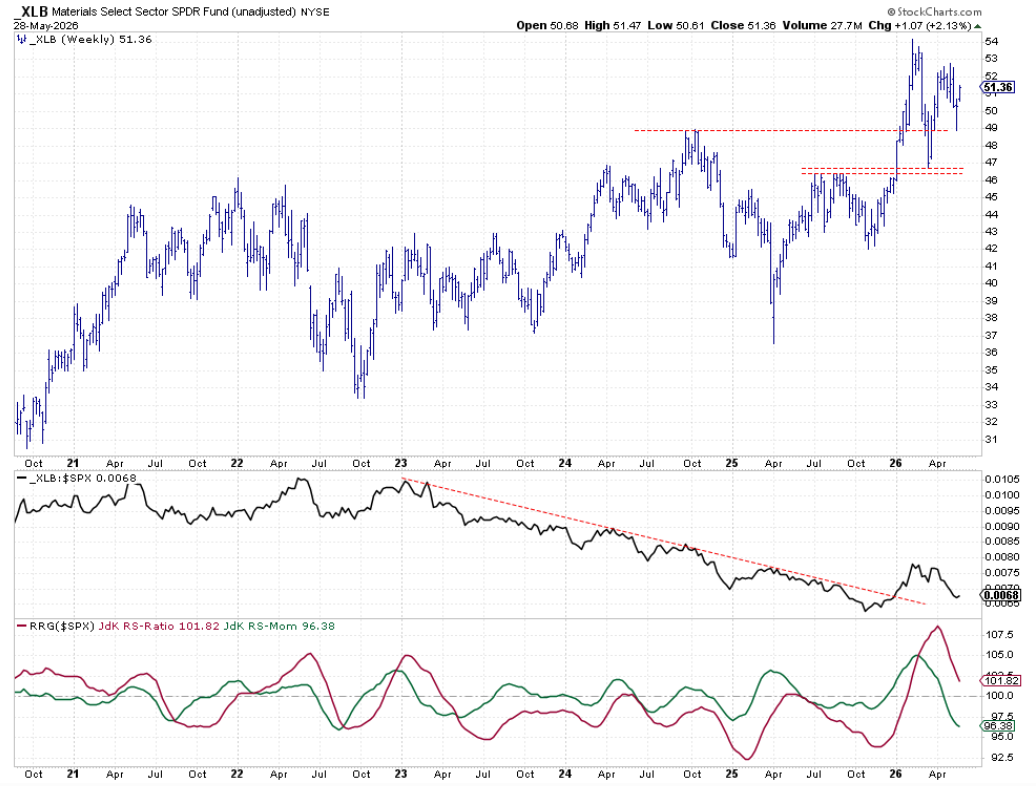
Materials broke out earlier but now trades sideways, forming a consolidation pattern. The raw RS line made a small double‑top; a new low near the current level would help keep Materials on the right side of the RRG. Both RRG lines are trending down, yet the RS‑ratio stays above 100, keeping the sector in the weakening quadrant.
Consumer Staples
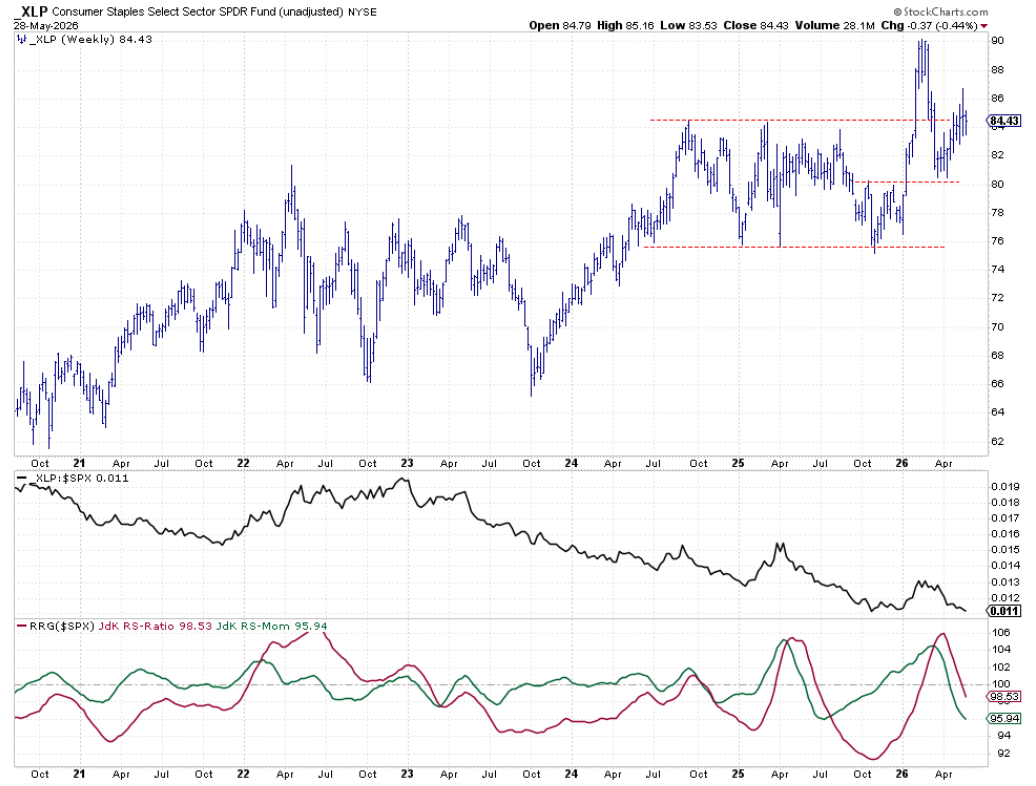
After a breakout and a pull‑back, Consumer Staples found support and is now testing resistance near the 85 level. Raw relative strength is close to previous lows, which could act as a floor, but it’s too early to be certain. Both RRG lines sit below 100 and are falling, placing the sector in the lagging quadrant.
Industrials
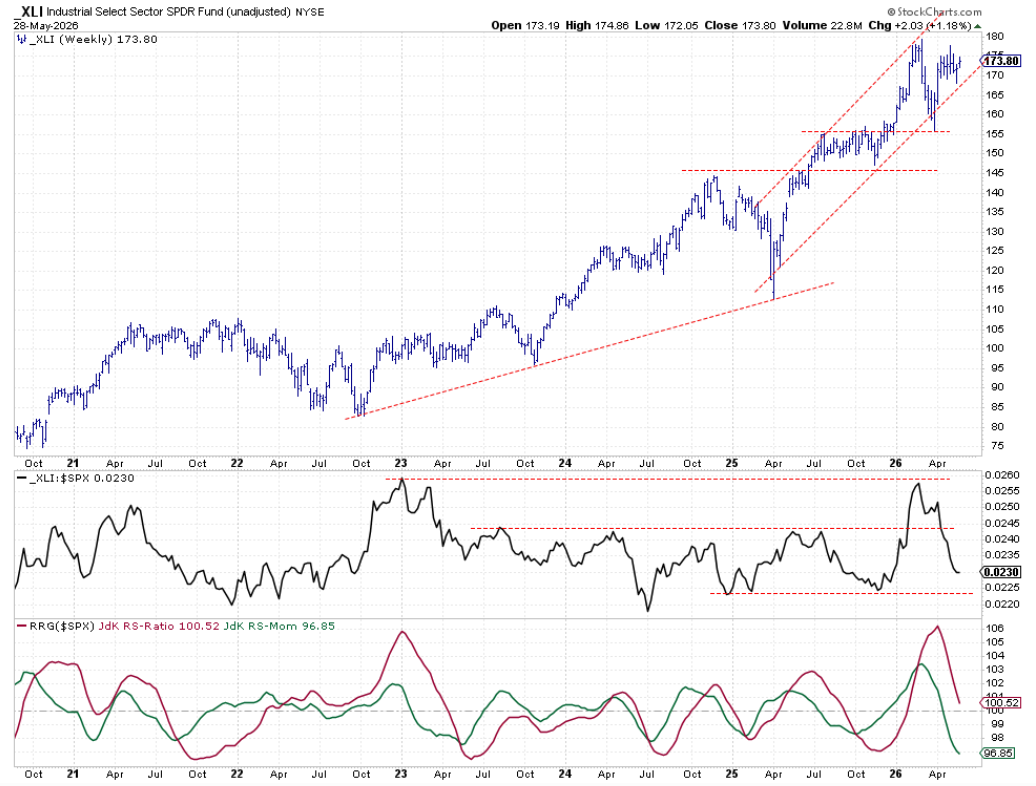
Industrials are moving sideways inside an upward channel. The raw RS line is trending lower after testing the 2023 high, and a test of support from 2025 lows could be next. Both RRG lines are slipping, keeping Industrials in the weakening quadrant.
Portfolio Performance
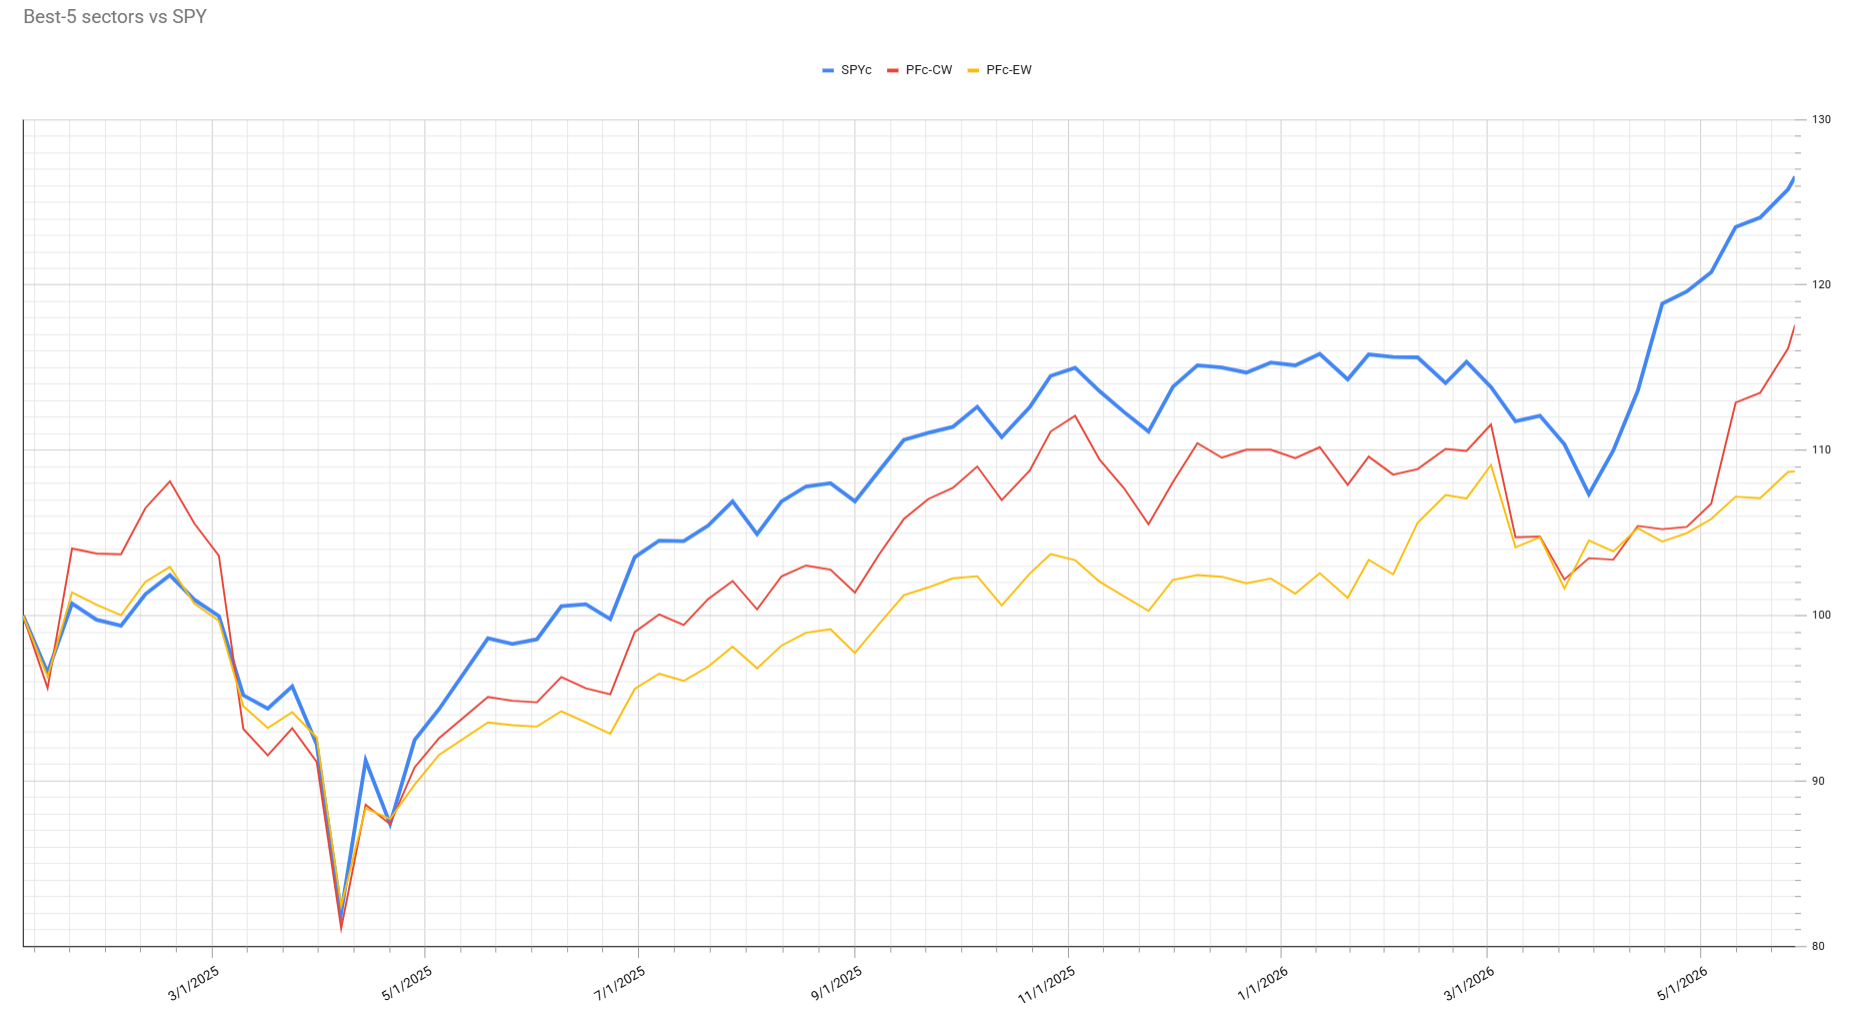
The cap‑weighted portfolio is closing the gap with the S&P 500 quickly. In the last five‑to‑six weeks, the lag fell from over 14 % to under 9 %. This improvement comes mainly from the strong performance of the Technology sector. Continued tech strength will be needed to keep the trend going.
#StayAlert
Source: Materials provided by https://articles.stockcharts.com.Note: Content may be edited for style and length.