

The S&P 500 and Nasdaq 100 are breaking records in May 2026, but not every signal underneath is positive. Some breadth indicators, which look at how many stocks are moving up or down, are flashing early warnings.
We will look at two of these indicators. They both study what happened before past market peaks and help us see if today’s market is starting to act like a late‑stage bull run.
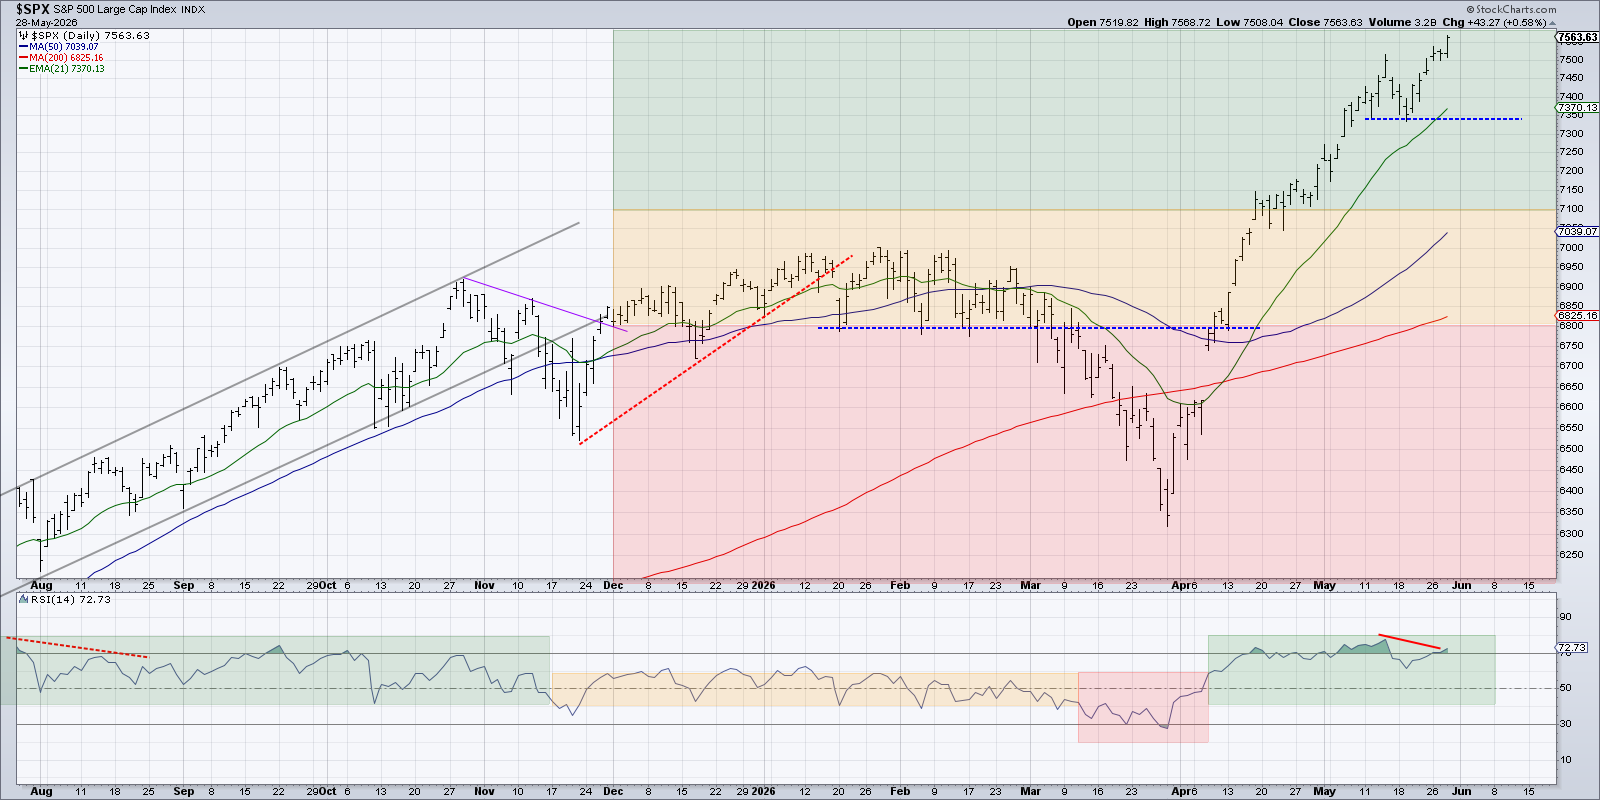
The daily chart of the S&P 500 still shows a clear uptrend: higher highs and higher lows keep appearing. From a trend‑following view, the market is still “innocent until proven guilty.”
But a contrarian mindset asks tougher questions when the market looks strongest. Are momentum readings still solid? Is market breadth expanding or shrinking? Are volatility and credit markets hinting at more risk? And are composite breadth indicators beginning to warn?
Hindenburg Omen Shows an Initial Alert
The Hindenburg Omen looks for three things at the same time, a pattern that often shows up before big market tops.
- The overall market must be in an uptrend, usually measured by a broad index moving higher.
- There must be a strange split in breadth: many stocks hit new highs while many others hit new lows.
- A short‑term breadth measure, the McClellan Oscillator, must turn negative, indicating weakening momentum.
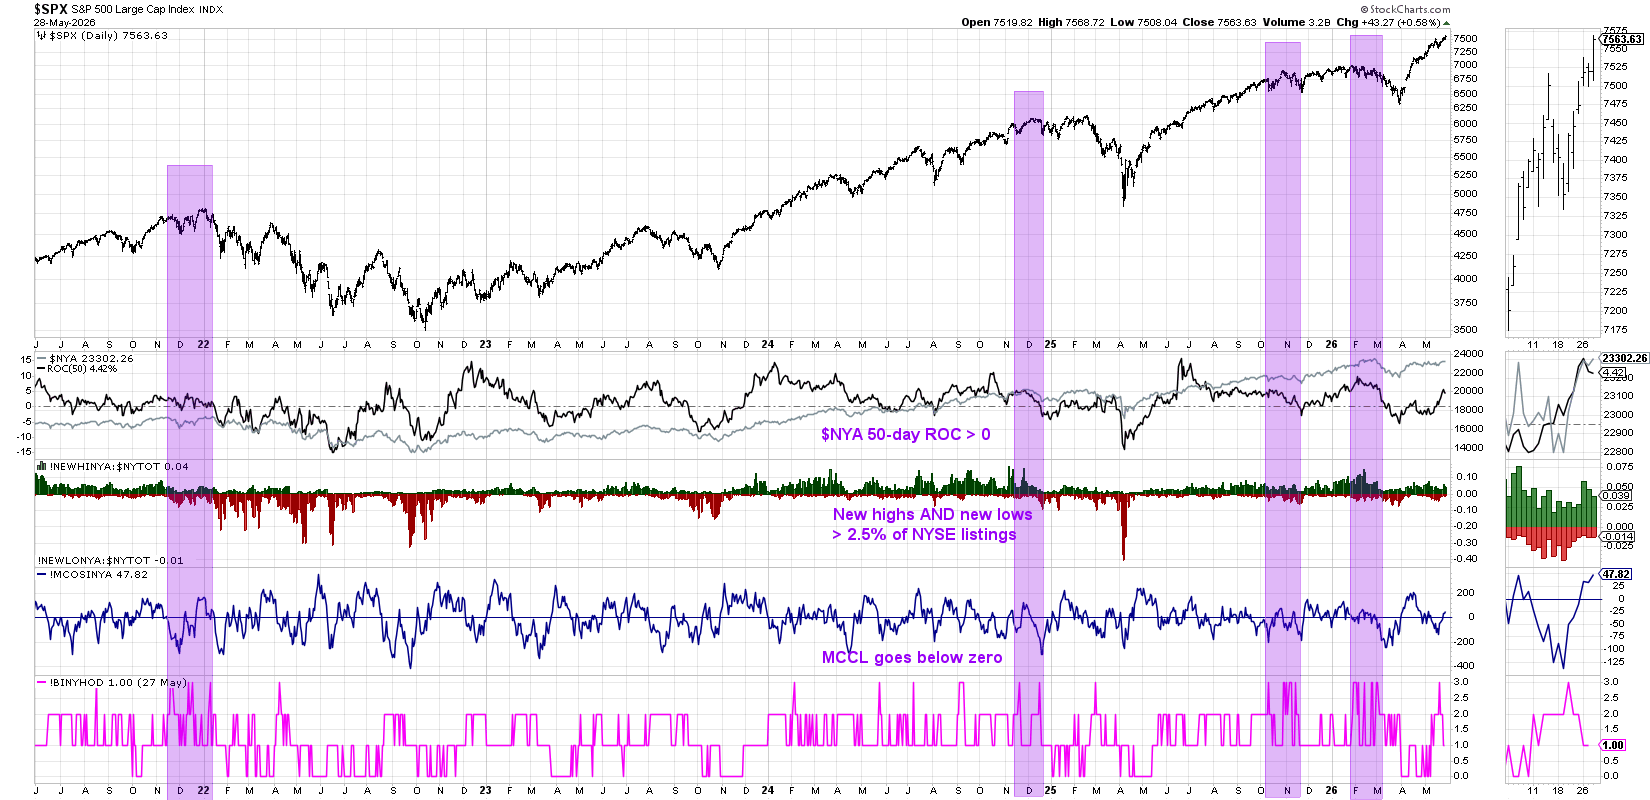
One single signal is not enough. Historically, the Omen only becomes significant when several signals appear within a month. A cluster of alerts usually points to a real turning point.
In recent years the Omen has given mixed results. It warned before the late‑2021 peak and the early‑2022 drop, but it also gave false alarms when the market kept climbing. The most recent alerts in November 2025 and February 2026 showed a small pullback, then the uptrend continued.
Think of the Hindenburg Omen as a tornado watch, not a tornado warning. It tells you conditions are becoming risky, but it does not guarantee a crash.
We now watch the coming weeks to see if more signals appear or if this proves to be another false alarm.
Titanic Syndrome Suggests Rough Waters Ahead
The Titanic Syndrome is simpler. It looks for a new 52‑week high in the Dow Jones Industrial Average, followed within a week by more stocks making new lows than new highs.
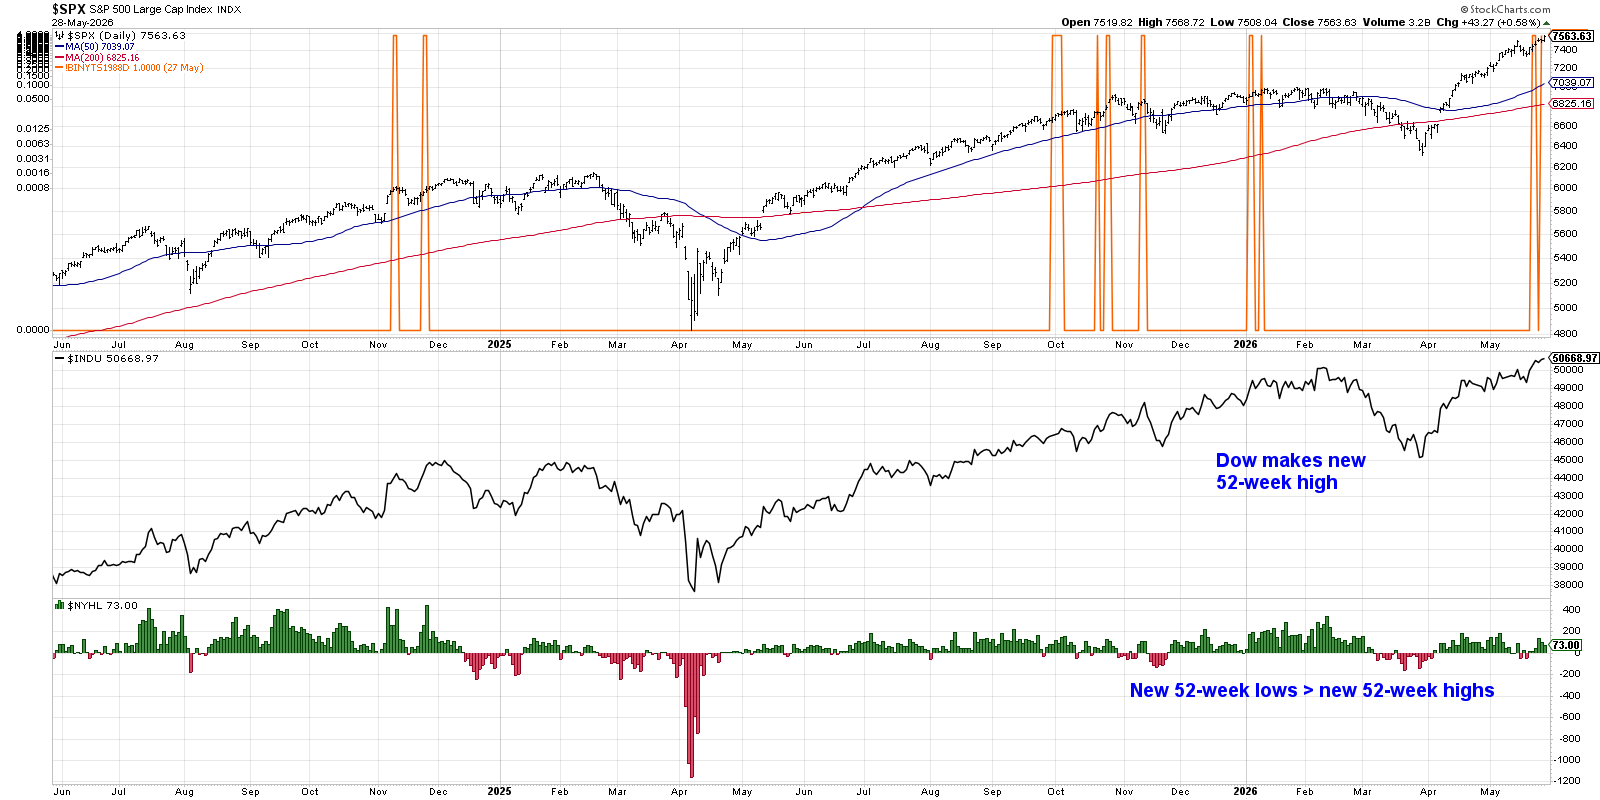
In plain words, the market looks strong on the surface, but inside more stocks are falling than rising. This lack of participation often appears before a market slows down.
Like the Hindenburg Omen, Titanic Syndrome is not a timing tool on its own. It has given both accurate warnings and false positives. When it appears alongside other warning signs, it can highlight a shift in market character.
What All This Means
Both indicators rely on the same idea: a healthy rally is backed by many stocks moving up. When that broad participation starts to break apart, even as indexes climb, it may signal a late‑stage bull market.
The fact that both the Hindenburg Omen and Titanic Syndrome have lit up in a short span makes the situation interesting. It doesn’t guarantee an imminent top, but it does suggest the market is behaving like it did before past peaks.
The next step is to look for confirmation: Are momentum indicators turning bearish? Are key support levels breaking? Until those signs appear, the primary uptrend stays intact. Still, with breadth weakening, investors may want to tighten risk management and keep a close eye on any further changes.
Good charts are always useful, but recognizing when the broader market environment may be shifting is just as important.
Disclaimer: This article is for educational purposes only and does not constitute financial advice. Always consider your personal financial situation and consult a professional before making investment decisions.
Source: Materials provided by https://articles.stockcharts.com.Note: Content may be edited for style and length.