


One hundred trading days have passed this year. Traders have faced many twists – political news, big earnings reports, and short‑term spikes. The S&P 500 ETF (SPY) is up about 10% so far, with two days left before June.
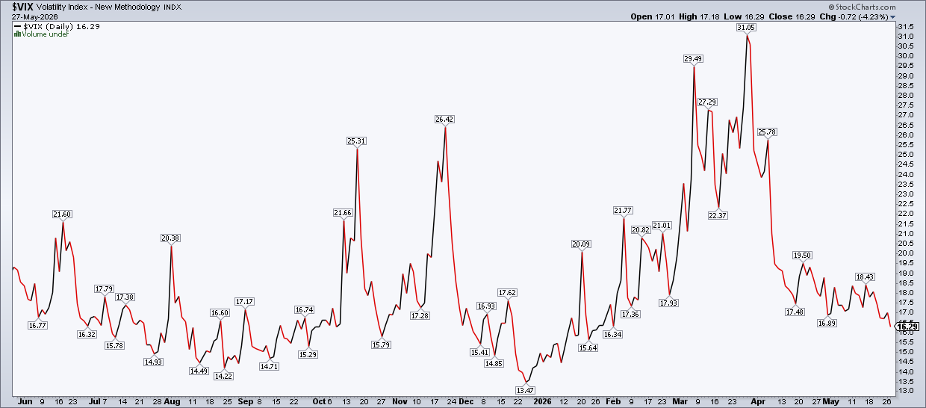
On Wednesday, SPY moved only 0.4% intraday – the smallest swing in five months. The VIX, a measure of market fear, fell to its lowest level since late January. At the same time, the ICE MOVE Index, which tracks interest‑rate volatility, also eased as policy makers changed. Lower stock and bond volatility is a welcome sign for the broader market.
Quiet Markets, Strong Signals
With less movement across assets, it is a good time to look at the big picture before the upcoming jobs reports. Watching the overall index helps spot trends when certain stocks are moving fast.
We see a mix of sectors: semiconductors are booming, while space‑related stocks are still searching for lift. At the same time, consumer groups, long‑term bond yields, crypto and precious metals are all showing weak links, keeping overall correlations low – a trader’s dream. But these links can change quickly, so keeping an eye on the whole market is important.
Key Intermarket Chart
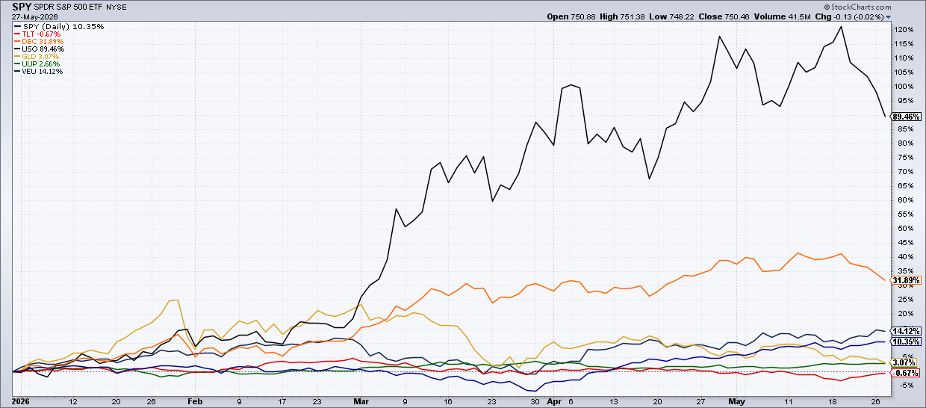
One useful tool is the Intermarket Analysis view from SharpCharts. I often suggest finance students start with this chart to see what is happening across markets.
The first thing that stands out is oil.
The United States Oil Fund (USO) climbed more than 120% year‑to‑date early in May, but it has pulled back to about a 90% gain for 2026. WTI crude fell for five days in a row, helping Treasury yields drop, consumer stocks rise, and a broader risk‑on rally take shape. Small‑cap and emerging‑market ETFs have also posted strong gains recently.
Commodities Lose Momentum
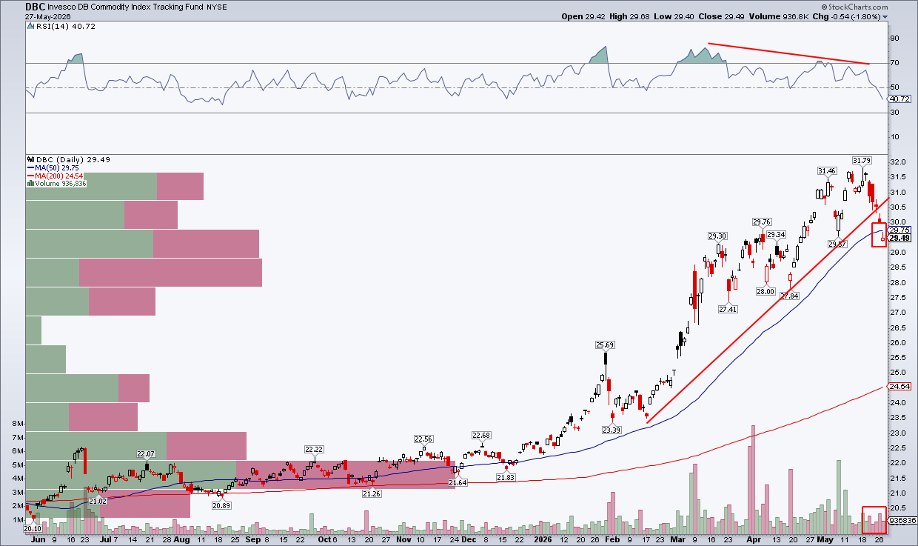
Looking lower on the chart, the Invesco DB Commodity Index Tracking Fund (DBC) is in red. The commodity ETF has fallen for several days, marking its worst five‑day slide since more than a year ago. It slipped below its 50‑day moving average for the first time since December, and its RSI indicator shows weak momentum.
This decline is not limited to oil; the whole commodity group is losing steam.
SPY’s Recovery
Two months ago, the market looked very weak. The March 30 low acted more like a checkpoint, and large‑cap stocks have since climbed about 20% from that point. Analysts are now raising their price forecasts for the S&P 500.
Adding a non‑U.S. equity fund, such as the Vanguard FTSE All‑World Ex‑U.S. ETF (VEU), to the intermarket view gives extra insight. VEU has outperformed SPY by roughly four percentage points this year, helped by strong performance from companies like Taiwan Semiconductor, Samsung, and SK Hynix.
Gold’s Shine Fades
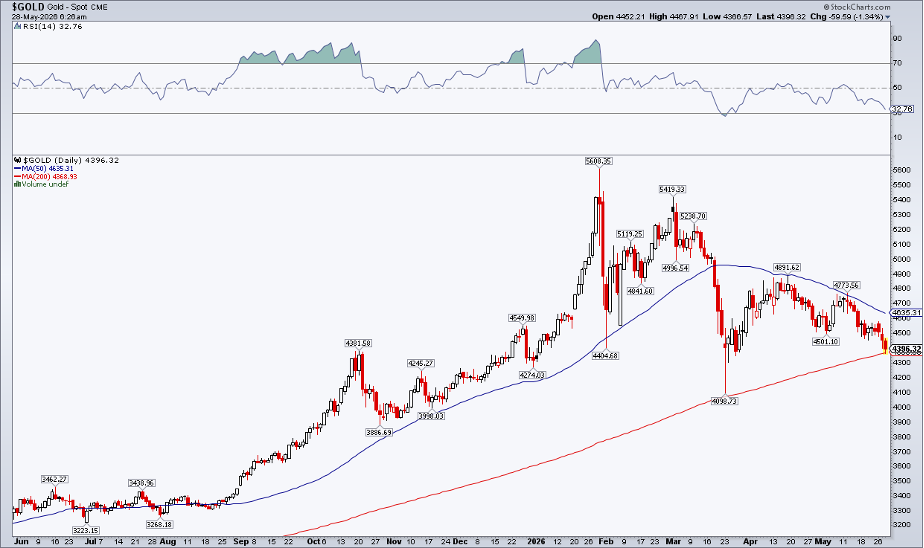
The SPDR Gold Trust (GLD) is up only about 3% in 2026. A recent drop could push gold into negative territory for the year after a big rally in January.
Higher real yields are not friendly to precious metals, and momentum has shifted toward chip stocks.
Don’t Forget the Dollar
The dollar has been quiet for the past year, one of the calmest periods on record. The Invesco DB U.S. Dollar Index Bullish Fund (UUP) has risen, but the underlying U.S. Dollar Index shows no clear trend.
Even though it seems dull, the dollar, euro, yen and pound could still move sharply this summer, so they deserve attention.
Bonds Remain Important Worldwide
The iShares 20+ Year Treasury Bond ETF (TLT) has bounced back, yet long‑term U.S. Treasury yields sit near 5%.
International long‑bond markets, especially in Europe and Asia‑Pacific, are still strong, and U.S. fiscal issues are adding upward pressure on rates.
For traders, the price trend for long bonds is down, so selling rallies in TLT could be a sensible summer strategy.
Bottom Line
Volatility has lowered and many markets sit near record highs. Chip stocks lead the rally, while overall equity participation stays solid. The S&P 500 Equal Weight ETF (RSP), along with small‑cap and international funds, may set new weekly records as we move into June. Watch commodity prices closely, especially oil, where bears are still active.
Disclaimer: This content is for educational purposes only and does not constitute financial advice. Always consider your personal situation and consult a professional before acting.
Source: Materials provided by https://articles.stockcharts.com.Note: Content may be edited for style and length.