

Earnings season ends next week. Nvidia will report on May 20 and its stock is near record highs. Retail companies, however, have had a rough ride.
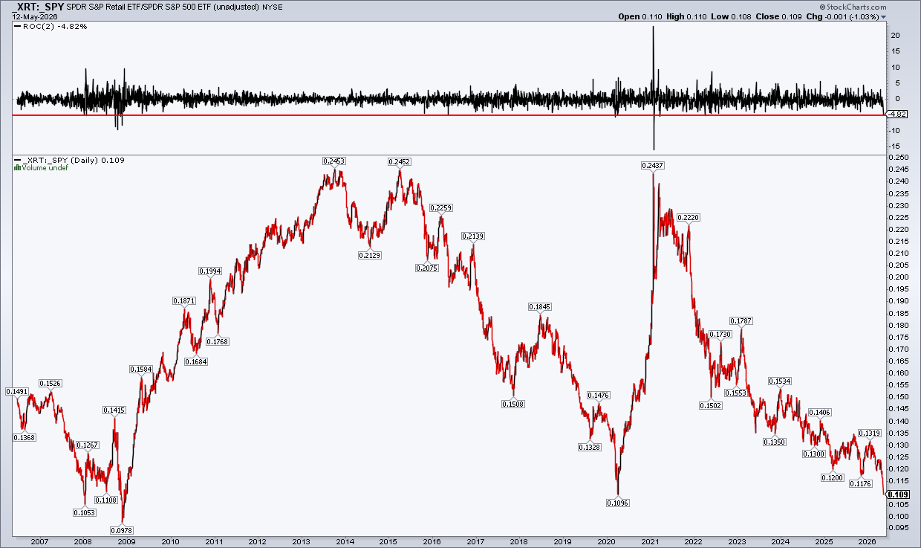
The SPDR S&P Retail ETF (XRT) fell 3.6% on Monday and another 1.2% on Tuesday. A 4.8% drop in two days is the worst since last October and almost the biggest back‑to‑back fall since April 2025. Compared with the S&P 500, the decline is the sharpest two‑day slide since 2008. Over the long run, XRT sits close to its lowest level versus the S&P.
While Nvidia and other AI‑heavy stocks enjoy strong optimism, retail looks far less bright. What do the charts say? Is there any chance for a bounce, or will the downtrend stay firm? Let’s look at the numbers.
Digging Through the Damage
When I checked StockCharts’ market summary, most retail groups showed very weak momentum.
To find the real movers, scroll to the US Industries panel, choose "Dow Industries" and sort by the SCTR score. This ranking uses six technical indicators to score each sector.
The top‑scoring sectors are heavy construction, aluminum, semiconductors, non‑ferrous metals, steel and electronic equipment – all tied to the AI and data‑center boom.
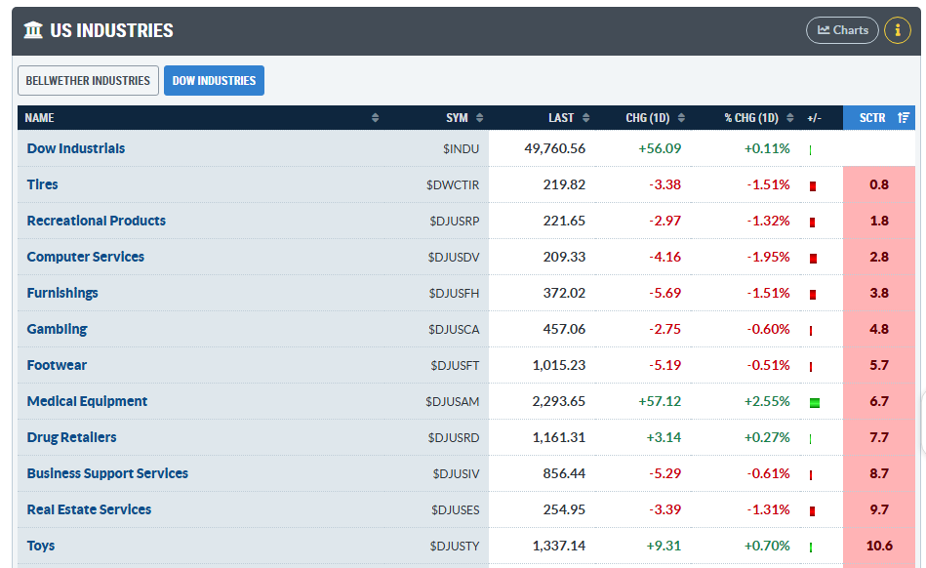
When the list is flipped, the lowest scores rise to the top. Tires, recreational products, computer services, furnishing, gambling and footwear all sit near zero. Retail appears throughout the bottom fifth of the Dow industries.
Why Retail Is Struggling
On a macro level, XRT behaves like a "K‑shaped" economy, moving with consumer sentiment. The fund is equal‑weighted, so a giant like Amazon has only a small effect on the price.
Several fundamentals hurt retail: gas prices above $4.50, rising inflation that squeezes real wages, and higher interest rates. Some analysts even joke that a mysterious virus is scaring traders.
There are bright spots, though. Companies like Starbucks and Visa are doing well because higher‑income households still spend.
A Bearish Pattern Emerges
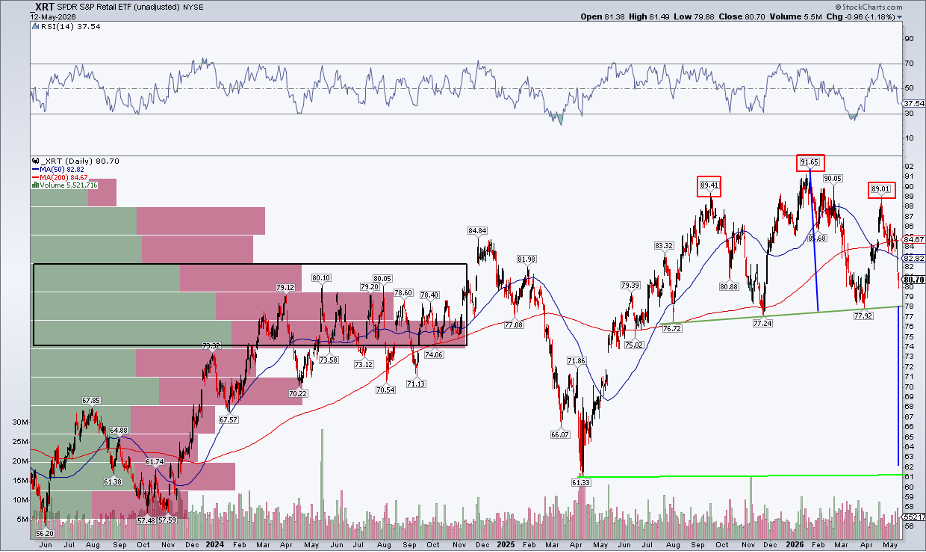
The chart shows a classic head‑and‑shoulders top. The neckline sits around $77‑$78, the shoulders near $89 and the head peaks at $92. If the price breaks below the neckline, the pattern predicts a move toward $62, matching the low seen in April 2025.
The long‑term 200‑day moving average is still rising, but the 50‑day average fell beneath it, creating a bearish "death cross." For now, traders expect the $78 level to act as support.
Earnings Week Could Decide the Next Move
Next week, big retailers such as Walmart, Home Depot, Lowe’s, TJX, Target and Ross Stores will report earnings. Even though these stocks are not the largest holdings in XRT, their results can move related consumer sectors sharply.
If XRT falls to $62, it would hit a new all‑time low compared with the S&P 500.
The "K" Keeps Widening
What could turn the tide? Often, a mega‑theme that lifts one group drags another down. The AI and data‑center story may need to lose steam before money flows back into retail.
Previous strong periods for retail (2009‑2013 and early 2020‑2021) followed hopes of economic rebirth. A new policy push from Washington or a change in Fed leadership might help, but that is for the macro experts to decide.
Seasonality Offers a Small Ray of Hope
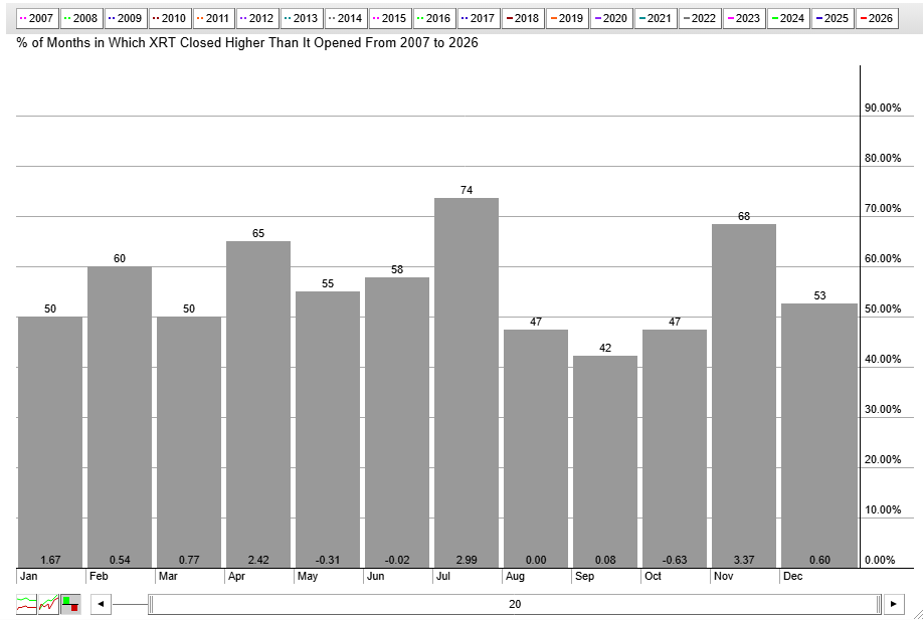
Looking at history, July has been XRT’s best month over the past 20 years. Between now and the end of the quarter, performance usually stays flat.
The Bottom Line
Retail’s weak performance signals caution for investors. Inflation and soft spending among lower‑wage households are clear headwinds. The coming earnings reports will show whether the downtrend deepens or steadies.
For now, keep an eye on XRT’s price action and its relative strength before putting money to work.
Disclaimer: This article is for educational purposes only and does not constitute financial advice. Always evaluate your personal situation or consult a professional before making investment decisions.
Source: Materials provided by https://articles.stockcharts.com.Note: Content may be edited for style and length.