


Do you feel the market rally might be getting too big?
Right now, the rally is thin. Only a few tech and chip stocks are pulling the market up, and they are doing it on low volume. A small change in the economy can make the rally fall fast.
On top of that, oil prices are still high because of the conflict in Iran. This makes the outlook for the next weeks more likely to go down. The VIX, which measures fear, is low at about 18, so buying protection is cheap.
When a rally looks fragile, it is smart to look for stocks that have risen a lot too fast. Those stocks often snap back hard. One such stock is Rocket Lab (RKLB). Below we show how to find a put trade on this stock in under a minute.
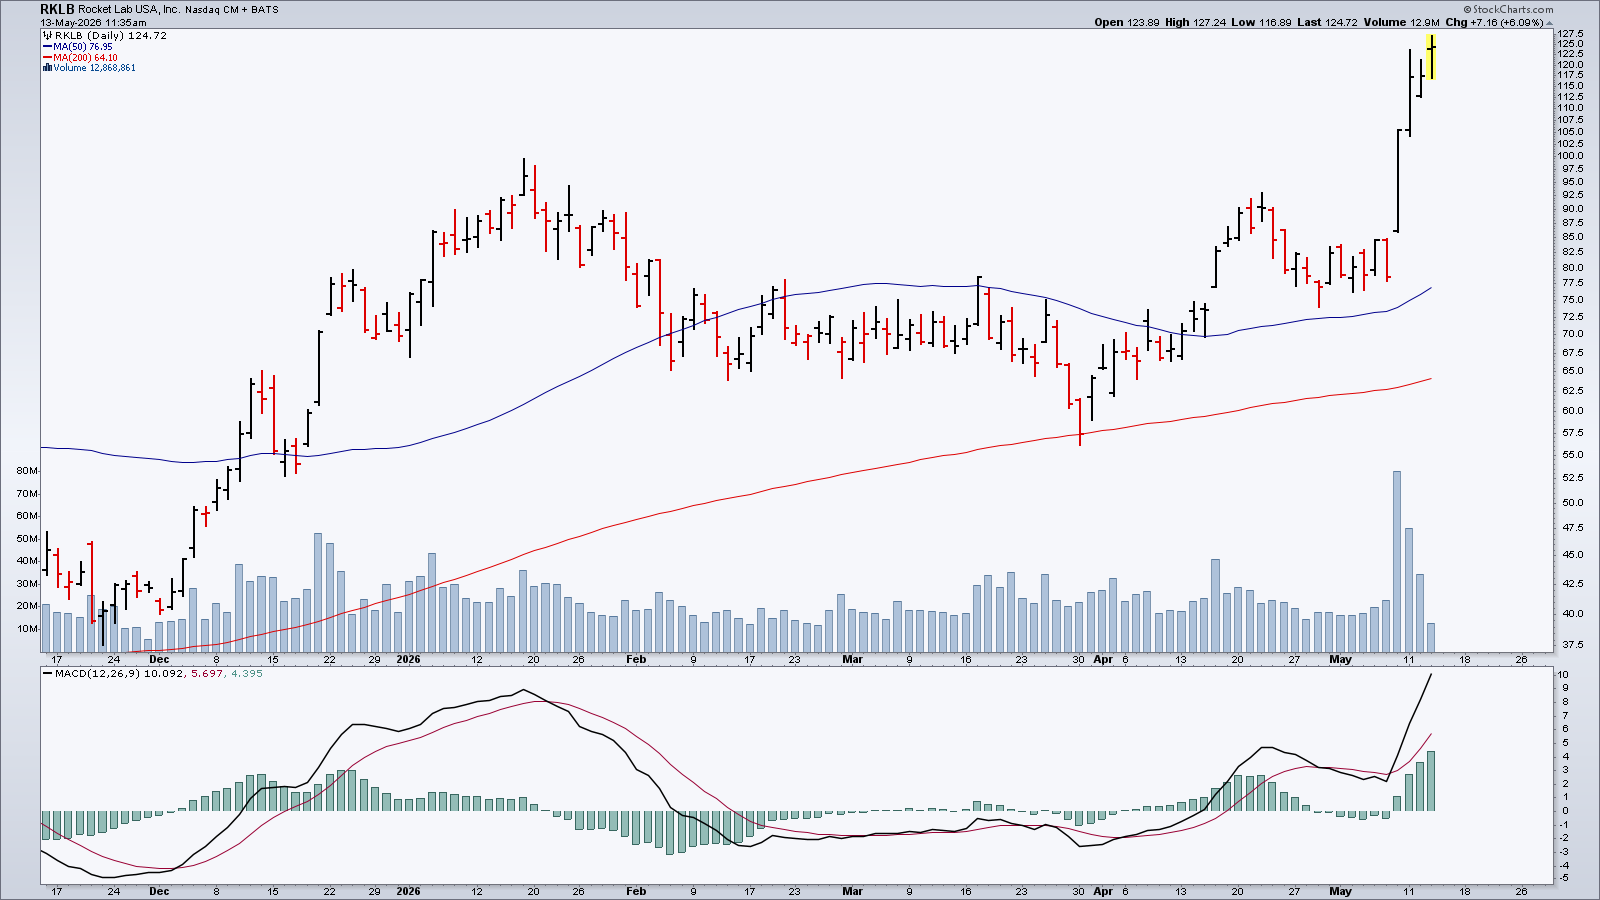
RKLB is far above its moving averages, a sign it may be ready for a “bearish counter‑trend.” Because option prices are cheap, we can buy an out‑of‑the‑money put to catch a quick drop while keeping risk low.
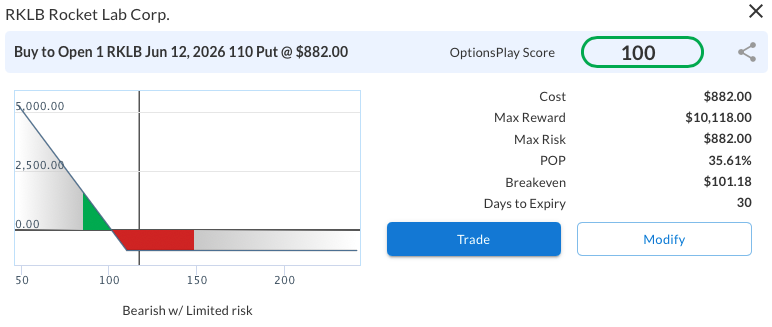
The RKLB Put Trade:
- Strategy: Long Put
- Expiry: June 12, 2026 (30 days)
- Strike: $110
- Cost: $8.82 per contract
- Breakeven: $101.20
Risking less than $900 can capture a fast pull‑back if the rally cracks.
How the Trade Was Found
Finding a trade like this by hand can take hours. The tool we used speeds the process to seconds.
Step 1 – Scan for Ideas
We started a “Bearish Counter Trend” scan. The scan looks for stocks that have moved up a lot and may be due for a correction.
Step 2 – Choose the Strategy
Because the VIX is low, we set the tool to look for 30‑day, out‑of‑the‑money long puts.
Step 3 – Let the Tool Do the Work
The scan returned 43 stocks that met the technical rules. It then filtered out those without liquid options, leaving about three dozen candidates.
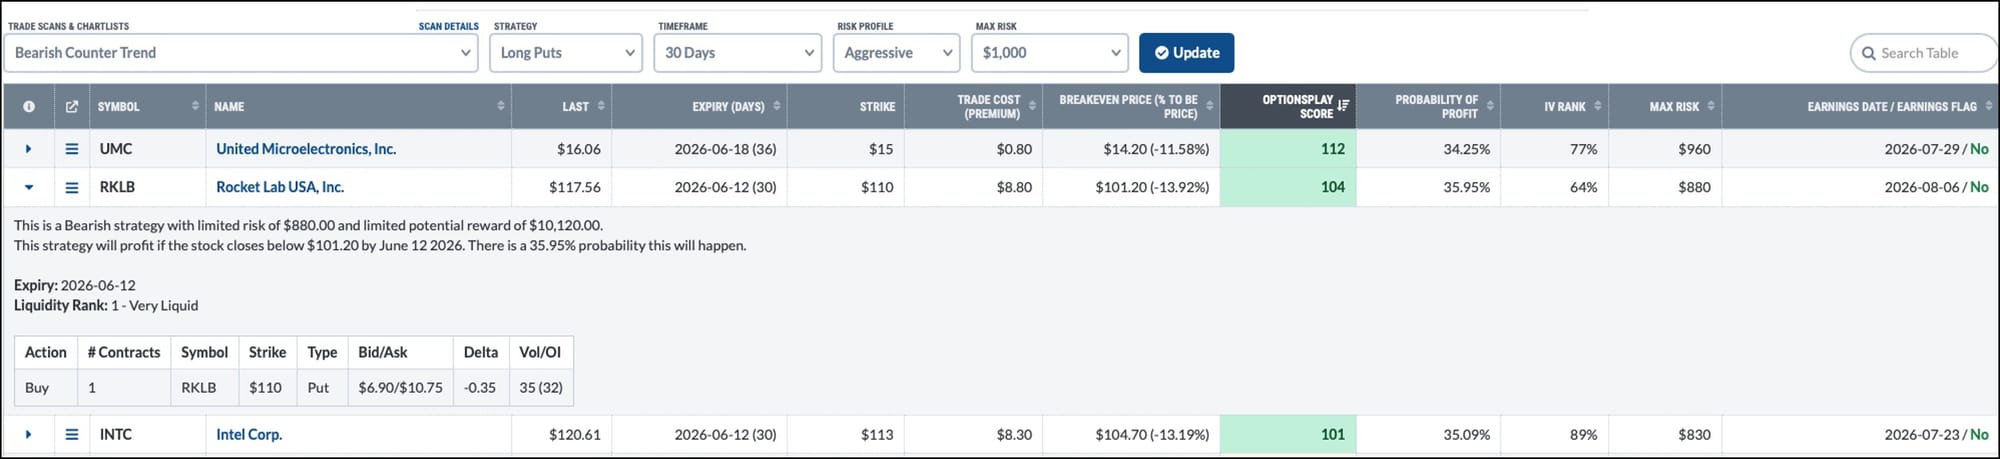
The tool ranked each stock by expected value. Only three had a positive outlook for a long put. RKLB topped the list with deep liquidity, a clean chart, and no earnings surprise before the expiration date.
In less than a minute we avoided the usual fatigue of manual charting and found a mathematically solid trade.
Why This Matters
The same workflow can be used for many other market themes. You can run the scan on any watchlist, pick from six pre‑built technical scans, and apply any of nine option strategies—from simple calls to advanced credit spreads.
By letting the software handle the heavy lifting, you spend more time deciding and less time searching.
Source: Materials provided by https://articles.stockcharts.com.Note: Content may be edited for style and length.