
CAC 40 Closes Lower
The CAC 40 cash index ended the session down 1.09% at 8,112.57 points, with an average trading volume of €3.864 billion.
The Paris stock exchange kept falling, following the same pattern seen in other European markets. The move happens while the world is uncertain, especially because of ongoing tension in the Middle East. After a short hope for calm between Washington and Tehran, new fighting was reported, which worried investors. Oil prices stayed around $99 a barrel.
On the trade side, the United States gave the European Union a temporary break on car tariffs. President Donald Trump decided not to raise them for now. The talks will continue until the July 4 deadline.
In this environment, only Stellantis managed to rise, gaining 1.84% to €6,522. Defense stocks like Thales and Safran fell, as did banks such as BNP Paribas, Crédit Agricole and Société Générale.
Future May – Key Levels
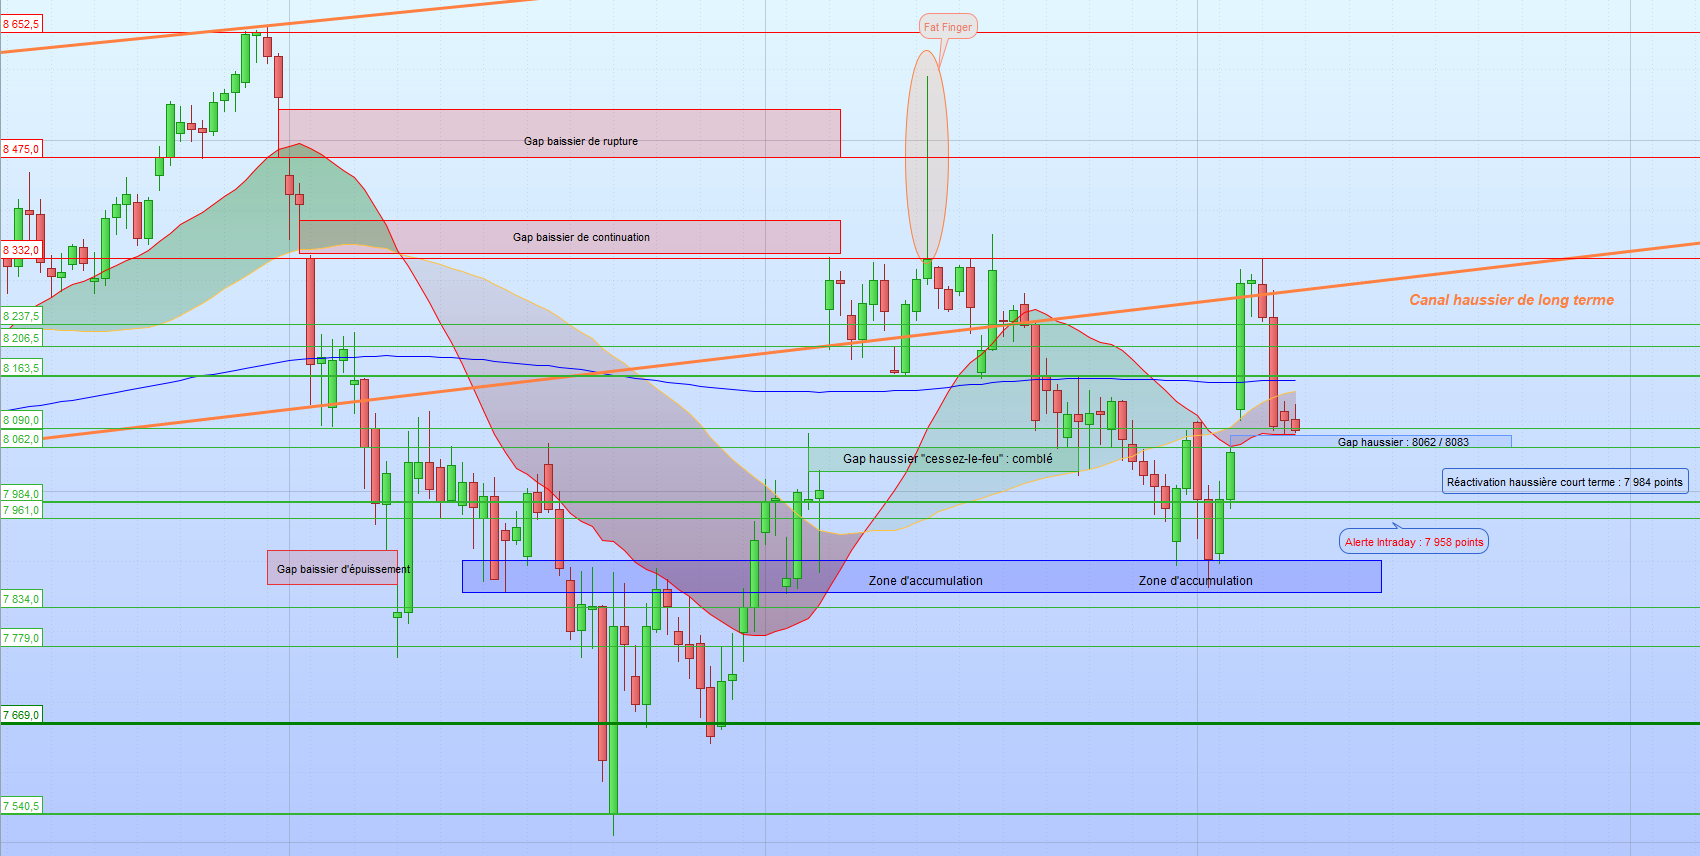
Resistance: 8,332 → 8,475 → 8,652.5
Support: 8,237.5 → 8,201.5 → 8,162.5 → 8,090 → 8,062 → 7,984 → 7,961 → 7,834 → 7,719 → 7,669 → 7,540.5
In intraday trading, the bias is upward when the price stays above 8,201 points.
Chart Overview
At 2 PM, the CAC 40 future showed a weaker tone after a nearly 3 % jump on Wednesday. Investors are now digesting the rise, filling part of the bullish gap from May 6 (8,062‑8,083 points). A break below the opening level of 8,116.5 points could trigger a pull‑back toward the intraday alert level at 7,958 points. Falling below the lower edge of that zone would raise the risk of a larger correction, with the next warning point at 7,719 points.
If sentiment improves, buyers could re‑enter the bullish gap and push the index toward the next resistances at 8,163.5 and 8,206.5 points. A successful move would bring the price back above its 20‑, 50‑ and 200‑day moving averages, a technical sign of a stronger, longer‑term uptrend. In a favorable market, the index could later aim for the continuation gap between 8,336 and 8,358 points, and eventually for the long‑term channel top near 8,800 points.
Note: The candle on 14/04/2026 showed an unusual spike caused by a “fat‑finger” order entry error. This anomaly was excluded from the daily analysis.
Technical Indicators
- The index trades above its 20‑day moving average.
- MACD histogram is decreasing but remains above the signal line.
- RSI is neutral.
- Trading volume is lower than the previous session.
Conclusion
The short pause in the rally suggests a cautious approach. We will wait for clear technical signals before adding new positions. Our portfolios have outperformed the CAC 40 since the start of the year, keeping measured equity exposure (49 % in the Investor portfolio and 44 % in the Dynamic portfolio). Any further strengthening will be considered selectively and only when the technical picture is unmistakable.