

It is jobs week on Wall Street. Most Q1 earnings are out, so traders are looking at the labor market again. This week also reminds us of a chart from the end of 2025 that still matters in 2026.
A Long‑Running Pattern Breaks
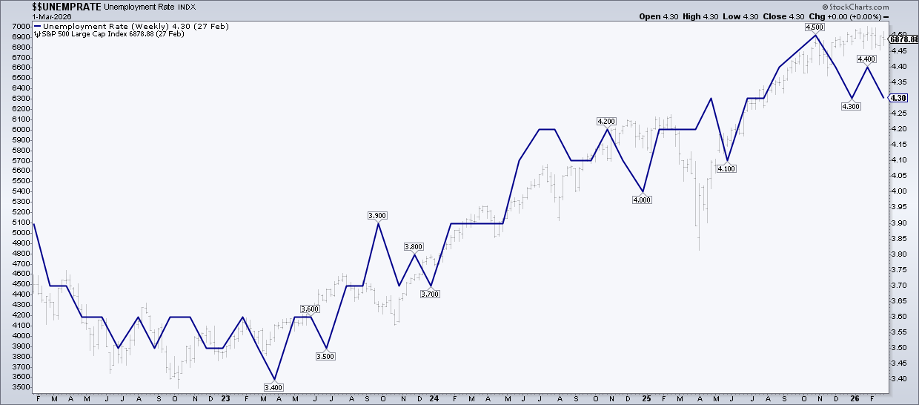
Last December I pointed out that the S&P 500 and the unemployment rate had moved together for four years. That seemed odd because higher unemployment usually hurts stocks. But the world is still in an inflationary era, so a cooler job market can be a good sign.
Now, in 2026, the two have split. The S&P 500 is up about 5.6% year‑to‑date, while the unemployment rate could fall to its lowest level since June last year. The Chicago Fed’s April advance estimate suggests the rate may be around 4.23%, down from a recent high of 4.56%.
Inflation Still Rules
The inflationary regime that began five years ago is still alive. For traders who look at the big picture, this matters a lot.
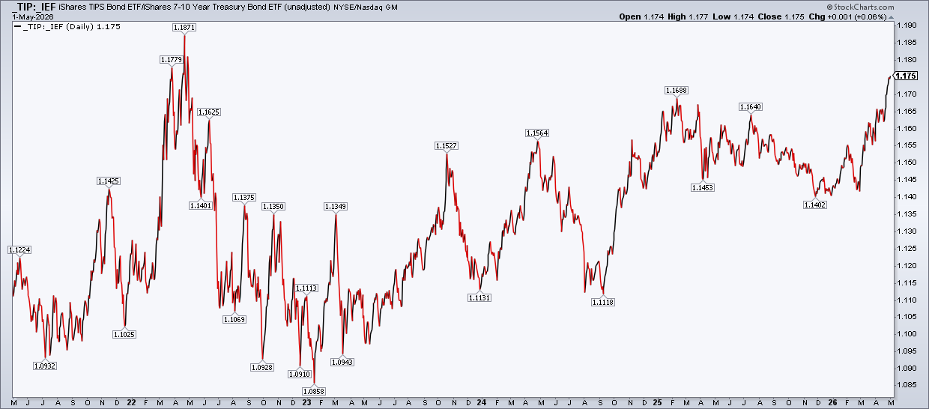
One simple tool is the ratio of the iShares TIPS Bond ETF (TIP) to the iShares 7‑10 Year Treasury ETF (IEF). This ratio is a market‑based inflation gauge. When TIP:IEF climbs, inflation expectations are rising.
Oil Prices Keep Pressure Up
Oil prices are a big driver of market‑based inflation. Both WTI and Brent stay above $100 a barrel, and U.S. gasoline is heading toward $4.50 a gallon. Everyone feels the heat.
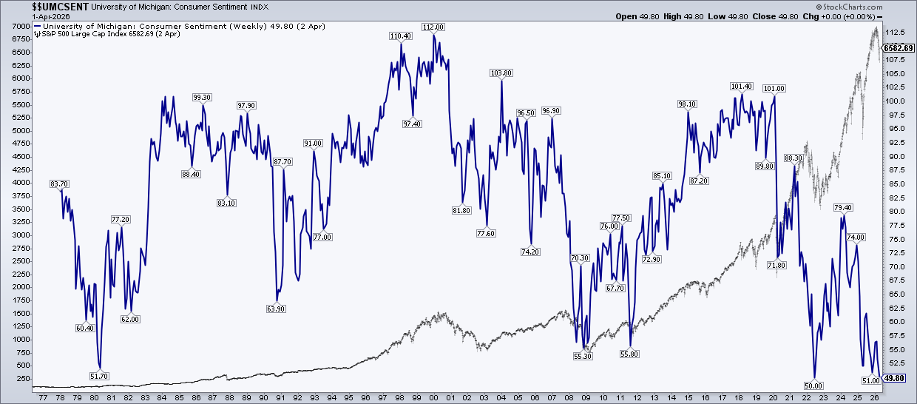
The University of Michigan consumer sentiment chart shows a record low in April, while the S&P 500 hit an all‑time high. It is a rare mismatch and shows how markets can surprise.
How to Shape a Mid‑Year Portfolio
Because inflation relationships are still strong, bonds and stocks tend to move together, with bonds often leading. Bonds and commodities usually move opposite each other, and the dollar has a weak link to commodities right now.
Energy Stocks Are Still in Play
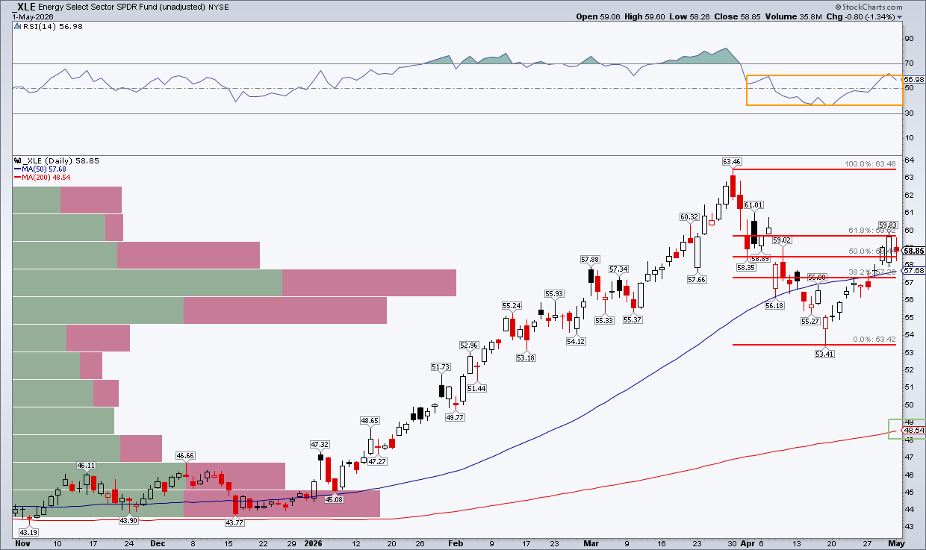
Traders may look at the Energy Select Sector SPDR Fund (XLE) for diversification. XLE dropped 16% from its March peak and found a low on April 17. The fund has been wobbling while the broader market moved higher.
Before the Iran conflict, energy stocks were already trending up. The recent pull‑back paused near the 61.8% Fibonacci level. A move above $60 could push the price toward its all‑time high of $63.46.
The 200‑day moving average is still rising, showing that the long‑term trend is bullish. The RSI is in a mixed zone, not extremely low, suggesting the uptrend may continue.
Valuations Look Better
Fundamentally, the S&P 500 Energy sector’s price‑to‑earnings ratio fell from about 21x to near 15x this quarter. That makes it one of the cheaper areas with solid earnings growth, which could be attractive if the U.S.–Iran tension continues.
Bottom Line
Jobs week reminds us to watch the macro picture. Unemployment may dip to multi‑month lows, while inflation signals stay bright. Keep an eye on inter‑market trends and especially on energy stocks like XLE.
Disclaimer: This content is for educational purposes only and does not constitute financial advice. Consult a professional before making any investment decisions.
Source: Materials provided by https://articles.stockcharts.com.Note: Content may be edited for style and length.