
Welcome to the Chart Fix!
We look for short pauses inside long uptrends when the market is bullish. The strategy below uses the PPO indicator to show the long‑term direction and the Aroon indicator to find quick breakouts after a pull‑back.
PPO Trend and Aroon Signal on SPY
The Aroon indicator, created by Tushar Chande, measures how strong a trend is and which way it points. Aroon Up (25) counts the days since the latest 25‑day high; Aroon Down (25) counts the days since the latest 25‑day low. When Aroon Up reaches 100, a new 25‑day high has formed, hinting at a breakout.

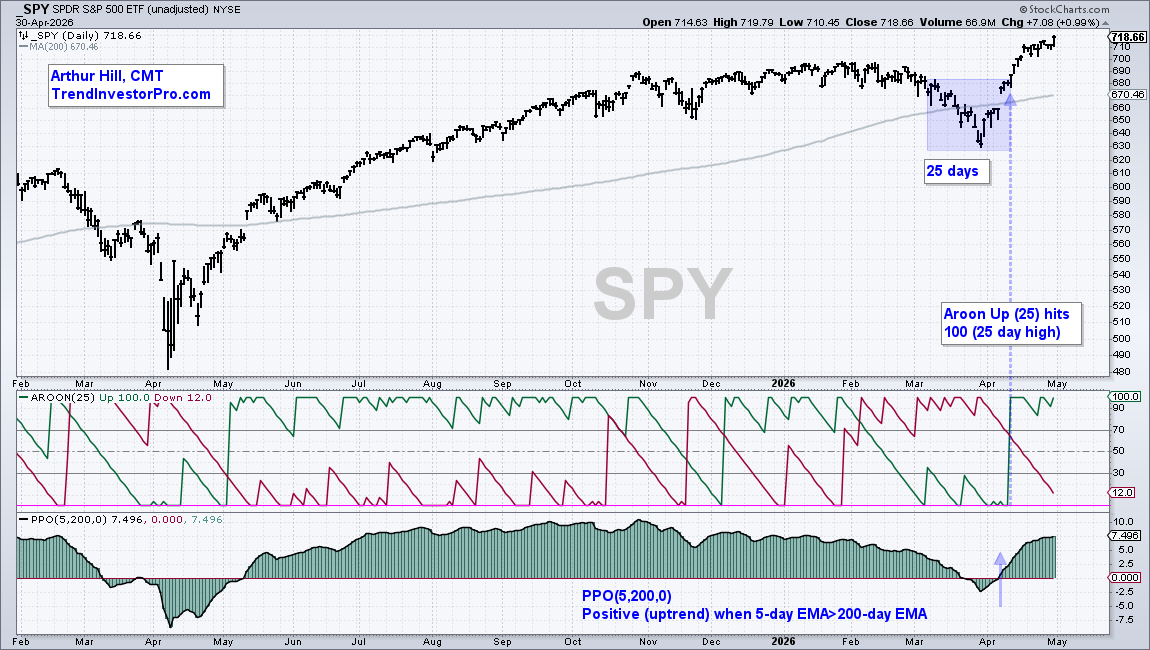
When Aroon Up stays above 50 and is higher than Aroon Down, the market tends to move up. A jump to 100 suggests a breakout. Because 25 days is short, this tool works best for patterns that last 4‑12 weeks.
Using Aroon to Find Breakouts in an Uptrend
Look at the Solar Energy ETF (TAN). Its PPO turned positive on July 2, marking the start of a long‑term rise. The day before, Aroon Up shot up to 100, confirming the breakout.
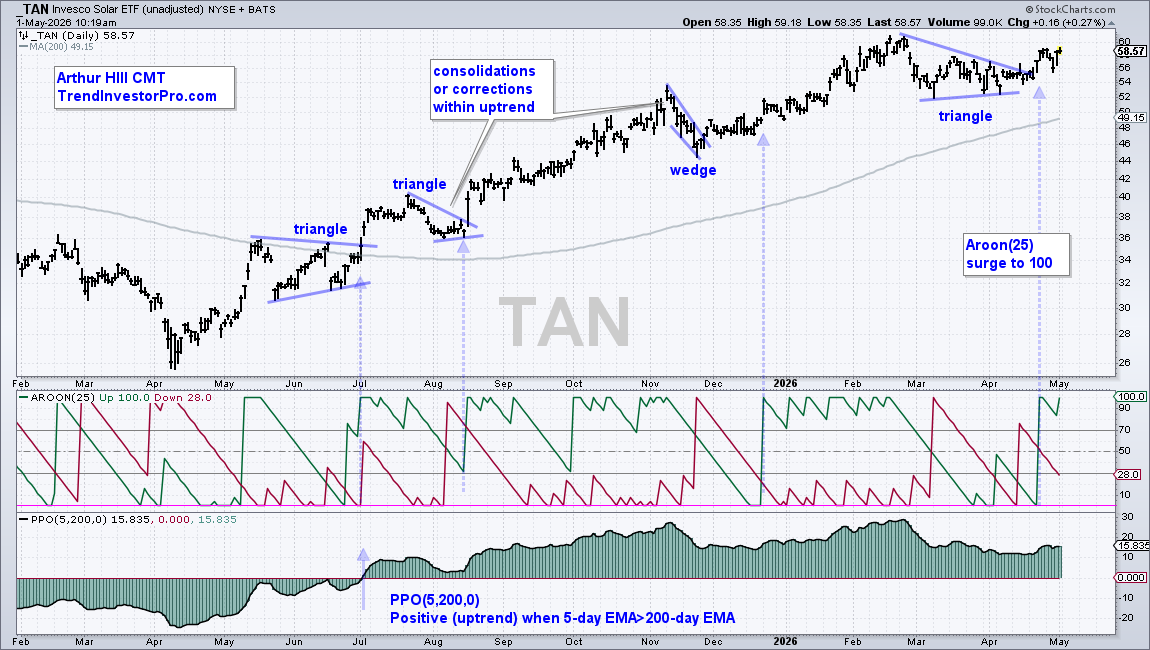
After the breakout, TAN formed several bullish patterns – a triangle in July‑August, a wedge in November, and another triangle in March‑April. Each time the price rested, Aroon fell below 50, and when it climbed back to 100, a new breakout occurred.
The blue dashed arrows in the chart show these moves. When Aroon rises from under 50 to 100, it signals a 25‑day high and a likely continuation of the uptrend.
We keep using these signals until the long‑term PPO turns negative or a clear bear market appears.
Source: Materials provided by https://articles.stockcharts.com.Note: Content may be edited for style and length.