

Before we start…
We already talked about the basics of a Market Summary. Now we’ll show how to link all the parts together. By focusing on the tabs at the top, you can work faster and get more insight.

Most people just use the top bar to move around. That works, but the real power is in reading what each button means.
Step 1 – Define the Environment
Start with the Market Summary. At this point you are not looking for a trade, only the overall mood. Is the market feeling risky, safe, mixed, or changing?
Insider Tip #1: Look for internal disagreement.
If the big indexes are up but few stocks are rising, the rally may be weak.
Your Goal: Set the scene. Everything else depends on this view.
Step 2 – Track Capital Flows (Sector Drill‑Down)
Next, see where money is moving. The sector view shows the eleven major groups and how they compare.
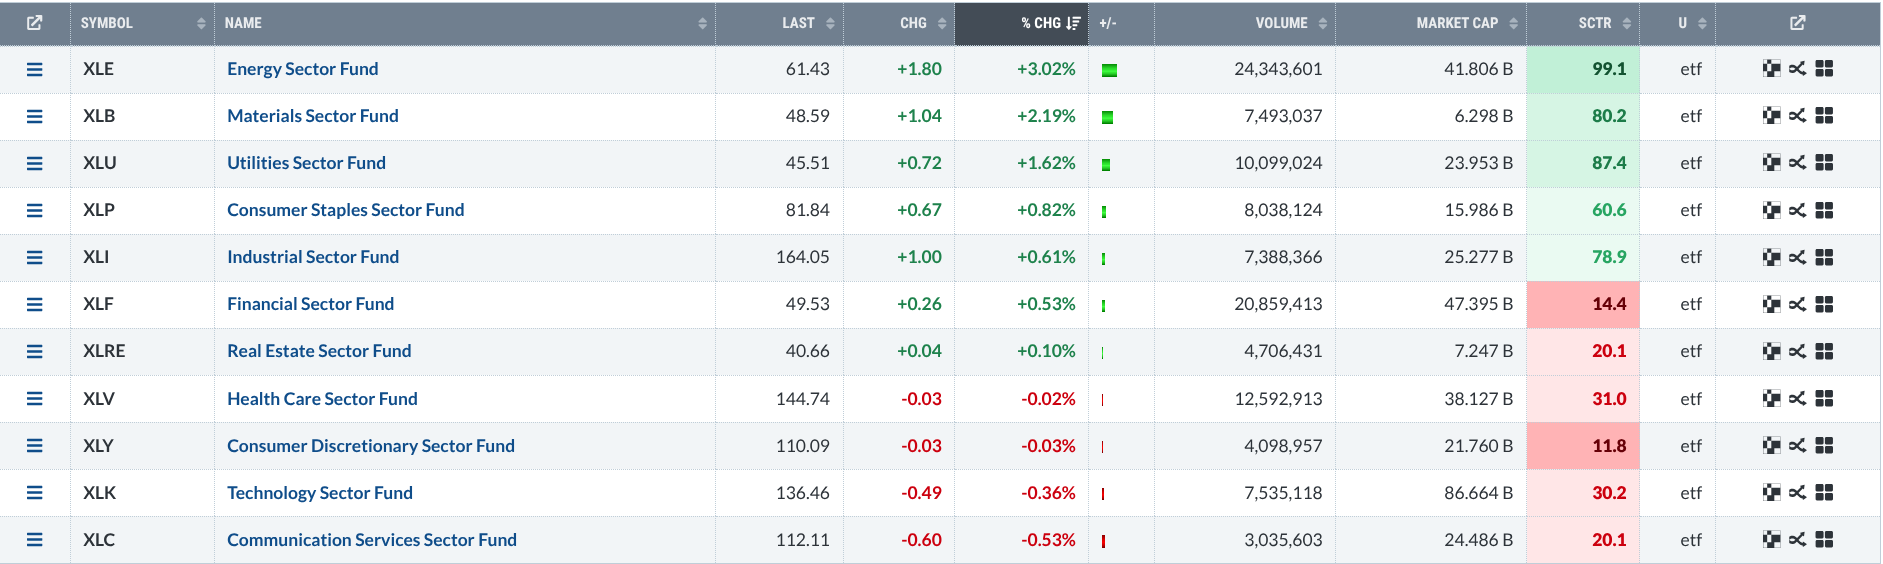
Insider Tip #2: Don’t fixate on the #1 sector.
Watch sectors move from the middle toward the lead. Tools like Relative Rotational Graphs help you compare short‑term and long‑term performance.
Your Goal: Spot early strength. Strong sectors often lead to strong stocks.
Step 3 – Test the Strength Beneath the Surface (US Industries)
Industries give a sharper view than sectors. They reveal whether a sector’s rise is broad or driven by a few groups.
Insider Tip #3: Look for clusters of strong industries.
A weak sector with a few strong industries may hint at early leaders. Digging deeper can give you an edge.
Your Goal: Go past the headlines and see what’s really happening.
Step 4 – Get to Know the Movers Behind the Indexes (Index Members)
Indexes move because their stocks move. Choose an index and see the individual names behind it.
Insider Tip #4: Use the SCTR column to find the strongest candidates.
The StockCharts Technical Rank (SCTR) shows technical strength. Look for stocks with high or rising SCTR, even if they are not well known.
Your Goal: Find the leaders in each index, whether famous or hidden.
Step 5 – Separate Noise from Strength (SCTR)
This tab lets you filter stocks by technical strength. You can sort by market cap, ETFs, or international exposure, and view SCTR over different periods.
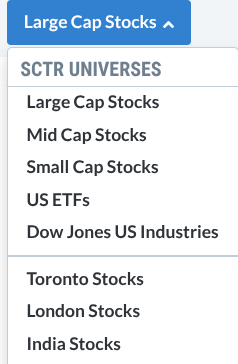
SCTR changes over time. A rising SCTR can be more meaningful than a static high number.
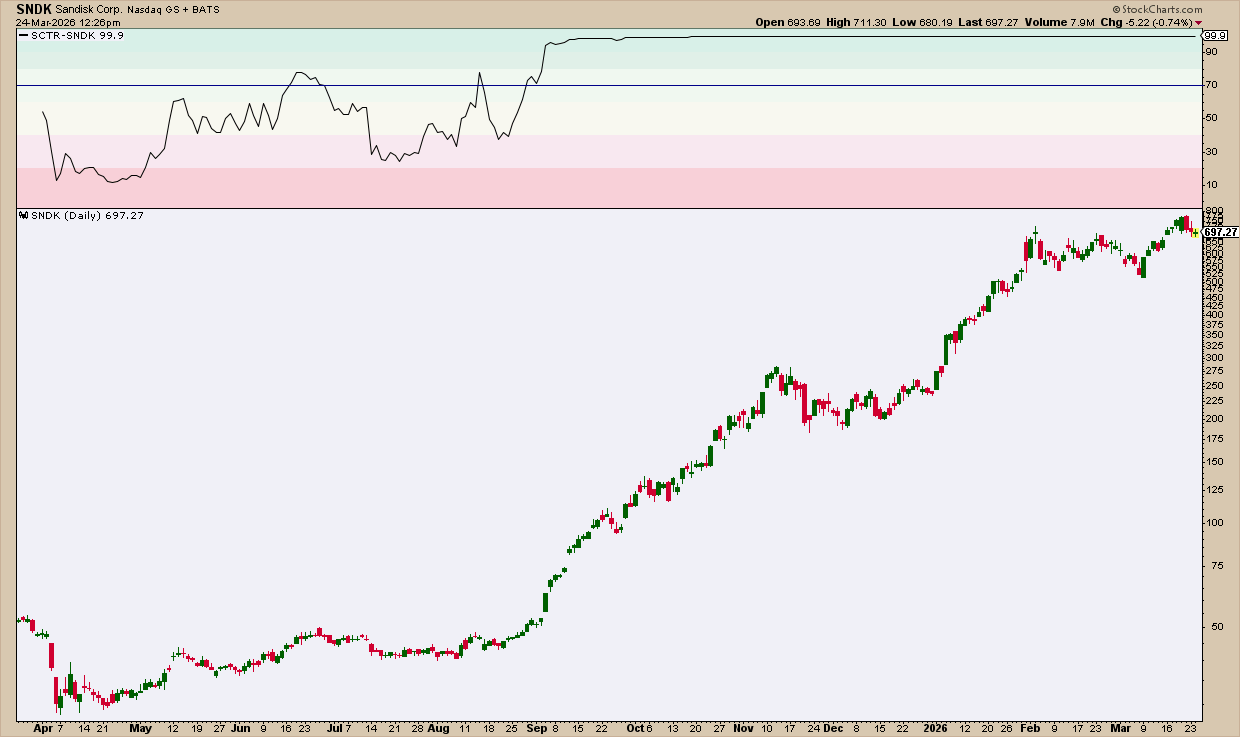
Insider Tip #5: Look for divergence.
If price stays flat while SCTR climbs, quiet buying may be happening. Watch for SCTR crossing above 70‑75, which often signals institutional interest.
Your Goal: Use the strong‑stock list as a starting point, then apply other tools to confirm a real opportunity.
Step 6 – Eliminate Hidden Risk (Earnings Calendar)
Ask yourself what could cause trouble tomorrow. Avoid surprises by checking upcoming earnings.
Insider Tip #6: Look for earnings clusters within a sector.
When many companies in a sector report close together, volatility usually spikes. Depending on your style, this can be a chance or a warning.
Your Goal: Anticipate short‑term moves by watching the earnings calendar.
Step 7 – Stress‑Test the Market’s Risk Appetite (Cryptocurrencies)
Crypto often reflects how much risk investors want. Use it as a quick risk gauge.
Insider Tip #7: Think of crypto as a high‑beta extension of equities.
Typical patterns:
- Crypto rises with stocks → strong risk‑on sentiment.
- Crypto falls while stocks rise → risk‑on may be weakening.
- Crypto leads the move → early shift in sentiment.
- Sudden crypto spikes → short‑term liquidity surge, not always lasting.
Your Goal: Use crypto as a quick health check on market risk.
Putting It All Together: A Workflow with an Edge
Here is the full sequence you can follow:
- Market Summary – set the overall mood.
- Sector Drill‑Down – see where money is flowing.
- US Industries – confirm strength inside sectors.
- Index Members – spot the stocks moving the indexes.
- SCTR Reports – filter for technical strength.
- Earnings Calendar – anticipate volatility risk.
- Cryptocurrencies – gauge risk appetite.
Each step cuts out noise and makes the market picture clearer, increasing your odds of success.
Bonus – Simple Combos Traders Miss
- Strong sector + rising SCTR + weak headlines → stealth accumulation.
- Weak sector + strong industry + rising SCTR → early breakout candidates.
- Strong stocks + upcoming earnings cluster → possible volatility spike.
That’s a Wrap
The advantage isn’t hidden in one tab. It’s in the order you use them. Move from big picture to details, cut the clutter, and you’ll gain both time and better market timing.
Source: Materials provided by https://articles.stockcharts.com.Note: Content may be edited for style and length.