

"What do you do with stop‑losses when the market is flat versus when it is trending up?"
When I saw this question, I pictured the chart of Palantir (PLTR). The stock has been moving side‑to‑side after falling below its long‑term average. That makes risk control easier to explain.
First, let’s look at how I protect a strong uptrend. I will use Google (GOOGL), one of the top growth stocks in May 2026, as an example.
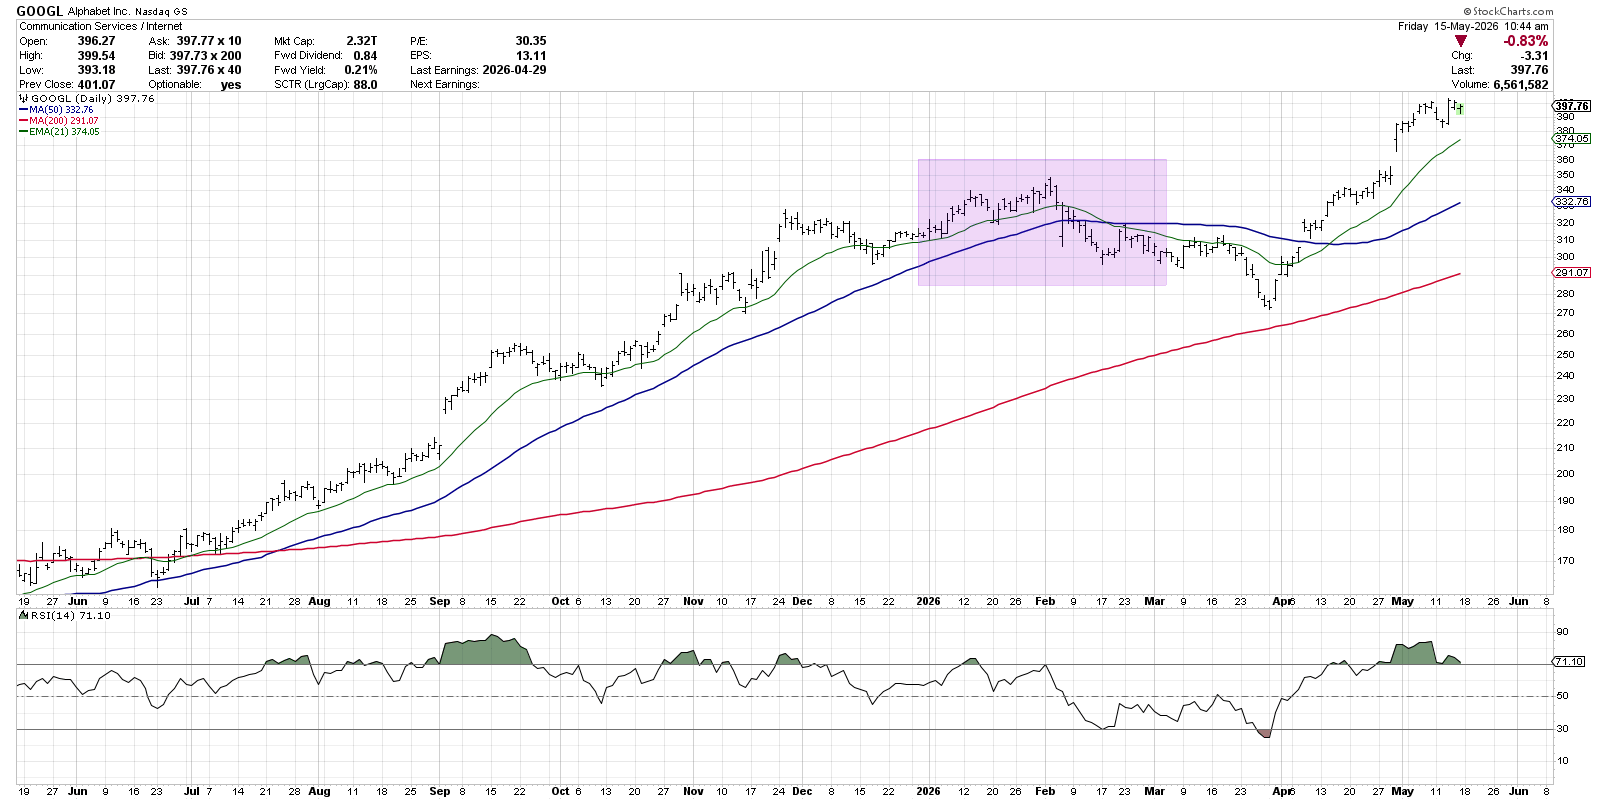
On the left side of the chart, Google was climbing higher and higher. Small pull‑backs often stopped near the 21‑day exponential moving average (EMA). This pattern shows a classic accumulation phase.
In the shaded area you can see a warning sign: the price kept making higher highs, but the Relative Strength Index (RSI) did not. That negative momentum gap was followed by a break below the 21‑day EMA and then below the 50‑day moving average as the RSI fell under 40.
Many traders focus on when to buy, but knowing when to sell is even more important. In a free webcast on May 27 I will walk through simple stop‑loss ideas such as percentage stops, ATR levels, moving averages, and support‑based exits. You can sign up for the free webcast on the site.
For me, a break of the 21‑day EMA is often the first signal to tighten a stop. If price keeps falling past the 50‑day EMA and momentum stays weak, I may reduce the position further.
This method works well for stocks that are firmly in an uptrend. But what if a stock is not trending upward?
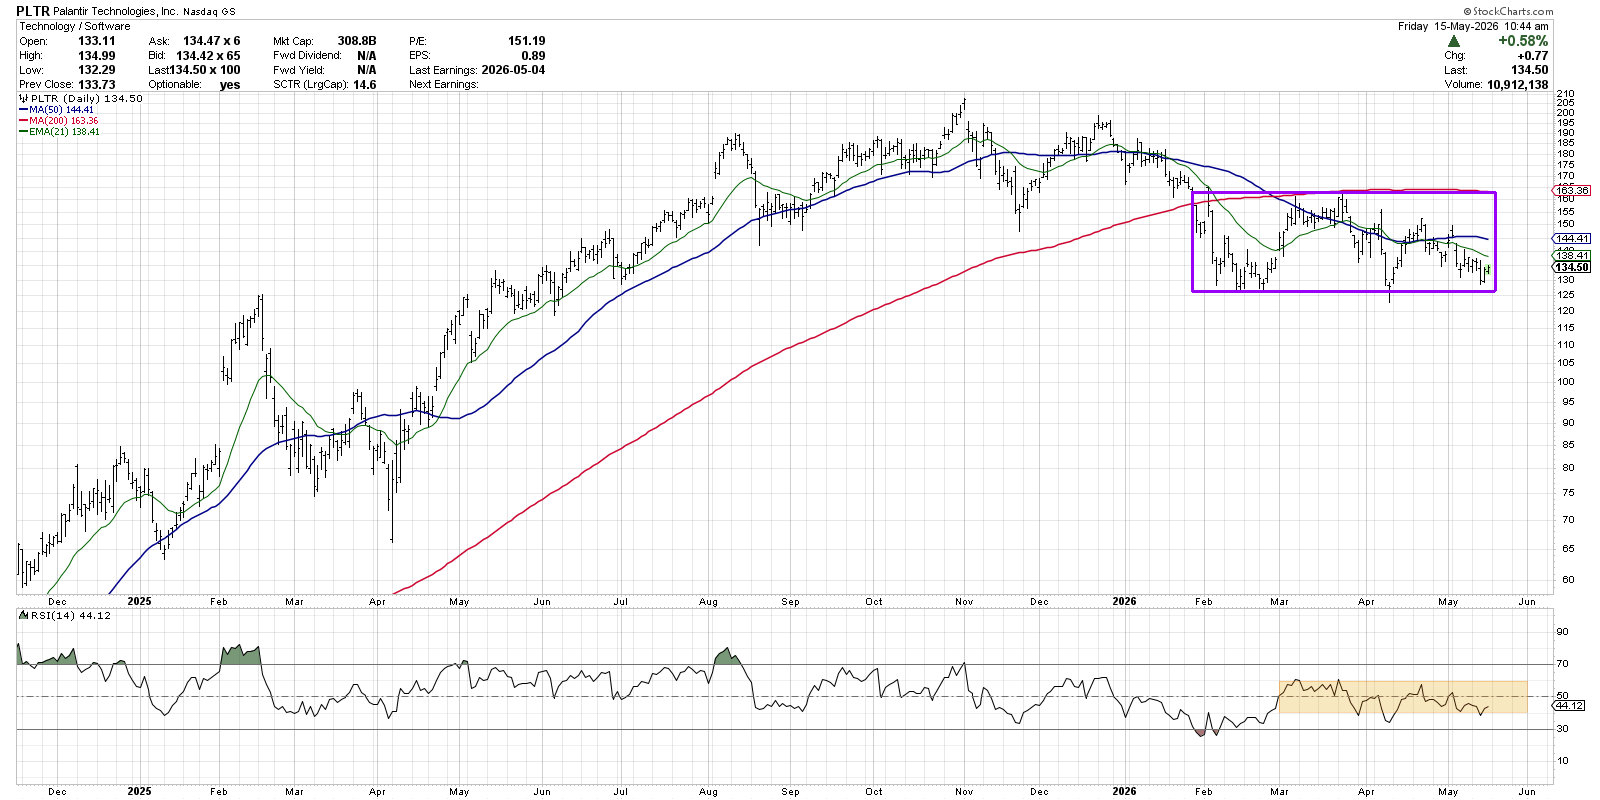
Palantir looks very different from the high‑flying AI stocks of Q2 2026. After dropping below its 200‑day moving average in January, PLTR has been trading between about $125 (support) and $160 (resistance).
The RSI is also flat, moving between 40 and 60. When the market is sideways and the RSI stays near 50, the chart tells you to be patient.
If I wanted to take a swing trade on PLTR, I would use the rectangle formed by the range. On the long side, a break below $125 with the RSI under 40 would signal a bearish outcome and a possible new downtrend.
On the short side – which I rarely use – I would set the stop just above the recent high of $163. A move above that level would also break the 200‑day average, suggesting a fresh uptrend and a reason to close any short trade.
Having clear stop‑loss rules is essential. One rule does not fit every chart. First you identify the market phase, then you choose the appropriate exit method.
RR#6,
Dave
P.S. Want to improve your investing process? Check out the free behavioral investing course.
Disclaimer: This material is for educational purposes only and does not constitute financial advice. Always consider your personal situation and consult a professional before acting.
Source: Materials provided by https://articles.stockcharts.com.Note: Content may be edited for style and length.