

Technology and Communication Services have been the market leaders since April, but they are not the strongest when we look inside the sectors.
Energy and Utilities have the most stocks above their long‑term averages, making them the healthiest parts of the market.
Energy and Utilities Lead Sector Breadth
The table below shows what percent of stocks in each sector are above their 200‑day exponential moving averages (EMA). Three points stand out.
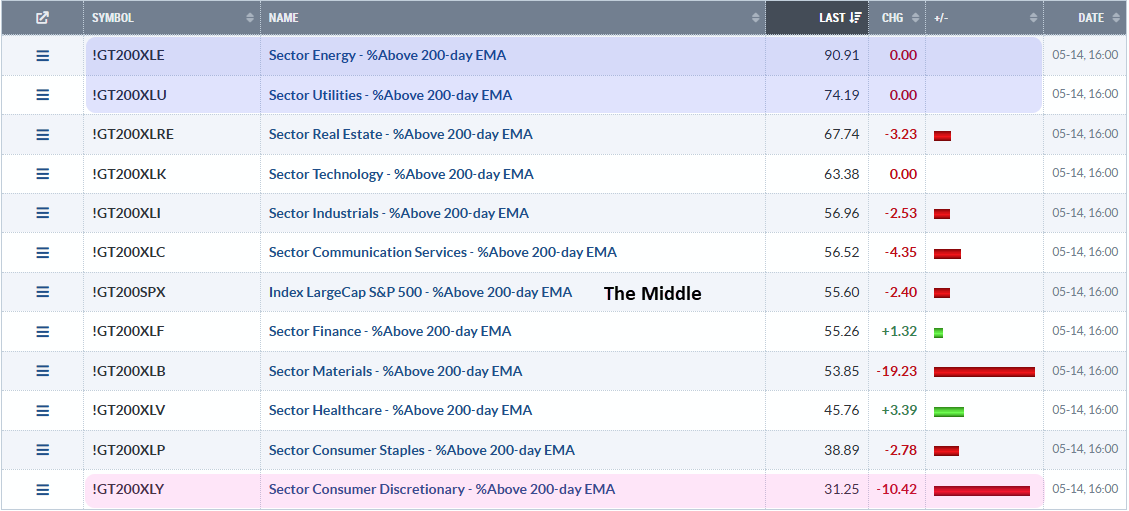
First, about 56% of all S&P 500 stocks are above their 200‑day EMA. That means a little more than half are in long‑term uptrends.
Second, the Energy SPDR (XLE) and the Utilities SPDR (XLU) have the highest percentages – roughly 91% and 74% – of stocks in long‑term uptrends.
Third, Consumer Discretionary has the fewest stocks above the EMA, only about 31%. Most of its stocks are in long‑term downtrends, showing weakness.
XLU Shows a Clear Uptrend
The next chart tracks three things for the Utilities SPDR (XLU): the High‑Low Percent, the percent of stocks above the 200‑day EMA, and the PPO(5,200,0) indicator.
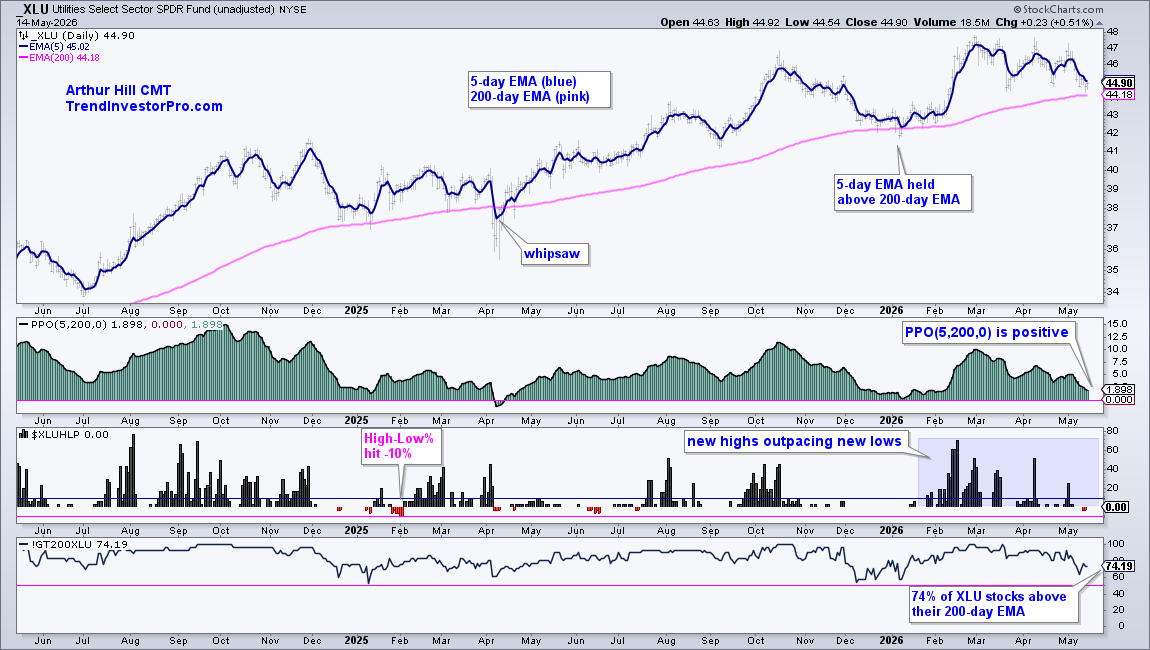
The PPO compares the 5‑day EMA to the 200‑day EMA. A positive value means the short‑term line is above the long‑term line, which signals an uptrend. Right now the 5‑day EMA sits about 1.9% higher than the 200‑day EMA.
The High‑Low Percent has stayed mostly positive in 2026, meaning new highs outnumber new lows. When the percent drops far below zero, the trend could turn.
For the last two years, more than half of the XLU stocks have been above their 200‑day EMA, currently around 74%. This shows strong long‑term momentum.
Short‑Term Breadth Gives a Mean‑Reversion Idea
The final chart looks at the % of XLU stocks above the 20‑day EMA. This short‑term measure can point to mean‑reversion opportunities.
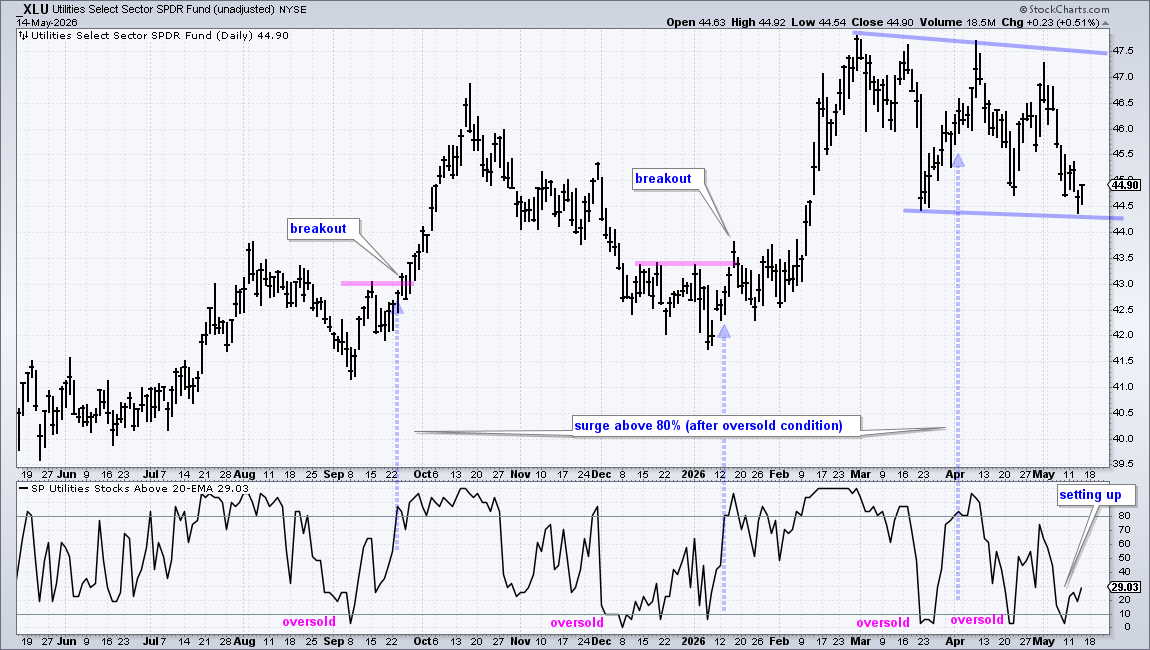
When XLU made a new high in February, the price fell back in March, creating a consolidation zone. A breakout above 47.50 could restart the rise.
If the short‑term % falls below 10%, the sector looks oversold. When the indicator then jumps above 80%, it often signals the end of the pullback and a new move higher.
We saw such a surge in early April, and another possible setup is forming as the % climbs back.
Source: Materials provided by https://articles.stockcharts.com.Note: Content may be edited for style and length.