

Advanced Micro Devices (AMD) beat earnings forecasts, helping the S&P 500 set a fresh record. Samsung’s market‑cap also hit a trillion dollars, pushing the emerging‑markets ETF to a new high.
But what’s happening beyond the United States? The AI boom is still growing, yet Europe and Asia have lagged the global market since February, especially after the flare‑up in Iran. High oil prices have also hurt countries that rely on Middle‑East energy.
New Hints of Geopolitical Optimism
There are fresh signs that the macro picture could be improving. After diplomatic moves between the United States and Iran, markets felt a bit more hopeful around Cinco de Mayo.
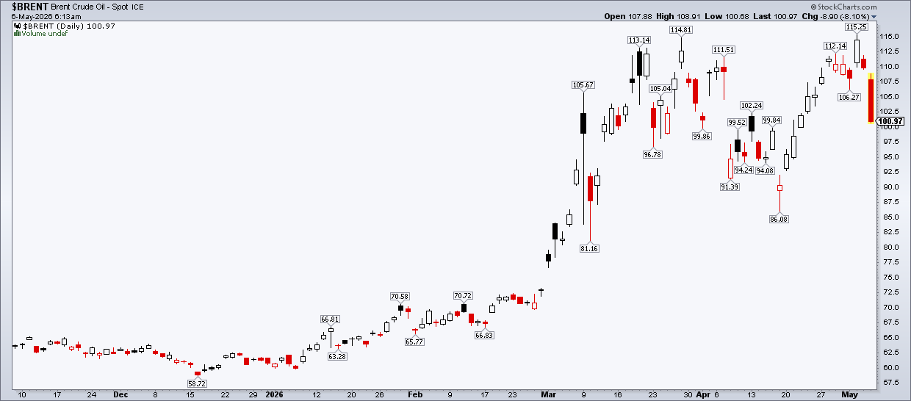
The United States Oil Fund dropped 7%, while WTI fell to about $95 and Brent to $103. Gasoline futures slipped, pointing to roughly $4.40 per gallon for the upcoming Memorial Day weekend.
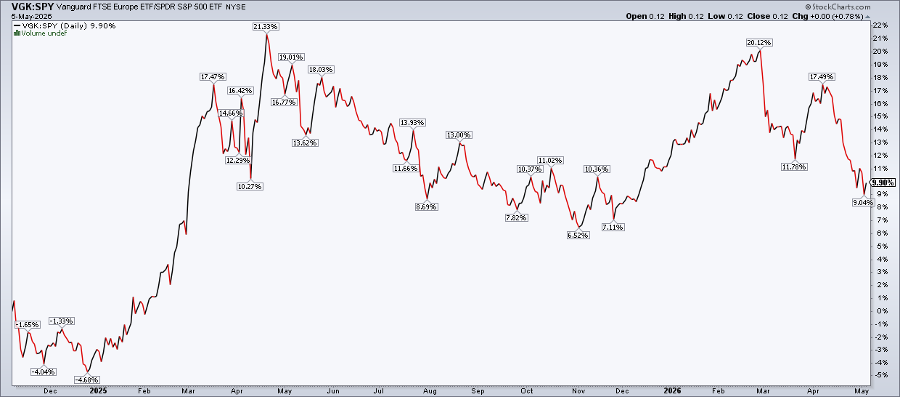
If the Strait of Hormuz blockades ease, European stocks could get a stronger boost. After three months of flat performance, some wonder if it’s time to favor the European ETF VGK.
VGK Looks Slow, But Shows Bullish Signs
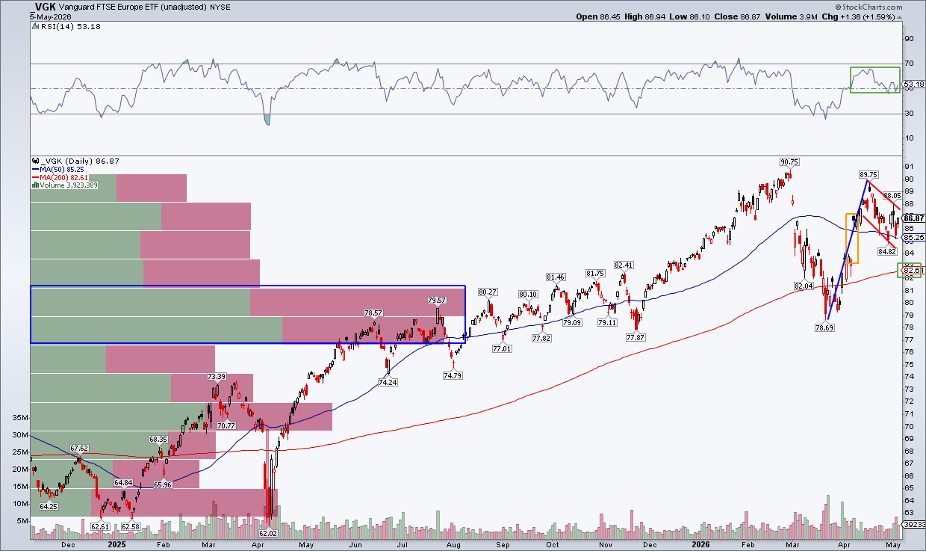
VGK, the European equity ETF, is still below its early‑year peak. However, an April 8 price gap from $83.53 to $87.03 gives a clue. The price entered the gap but didn’t fully close it, which can be a bullish hint.
The short‑term 50‑day moving average is slipping, but the price has bounced off it a few times this quarter. The long‑term 200‑day average is still rising, indicating the overall trend stays in the bulls’ hands.
Momentum After a Healthy Pullback
The RSI indicator fell into oversold territory in March and has now climbed back near the neutral 50 level. The 13% price drop looks like a normal correction rather than a crash.
Is It a Real Bull Flag or Just Hope?
Even though VGK has lagged the S&P 500 since late February, the recent dip resembles a bull flag. If the price breaks above the recent high of $89.75, a move toward $100 could be on the table.
Seeing a clear break above $89 would suggest a fresh leg higher for global equities.
EUR/USD: A Messy Chart With Big Implications
The euro jumped 70 pips after the U.S. announced a pause on “Project Freedom” in the Strait of Hormuz. Still, the EUR/USD pair shows no clear sign of a lasting peace dividend.
The pair formed a bearish death cross (the 50‑day average fell below the 200‑day). Support sits around $1.14, and three recent breakouts failed, making the chart look chaotic.
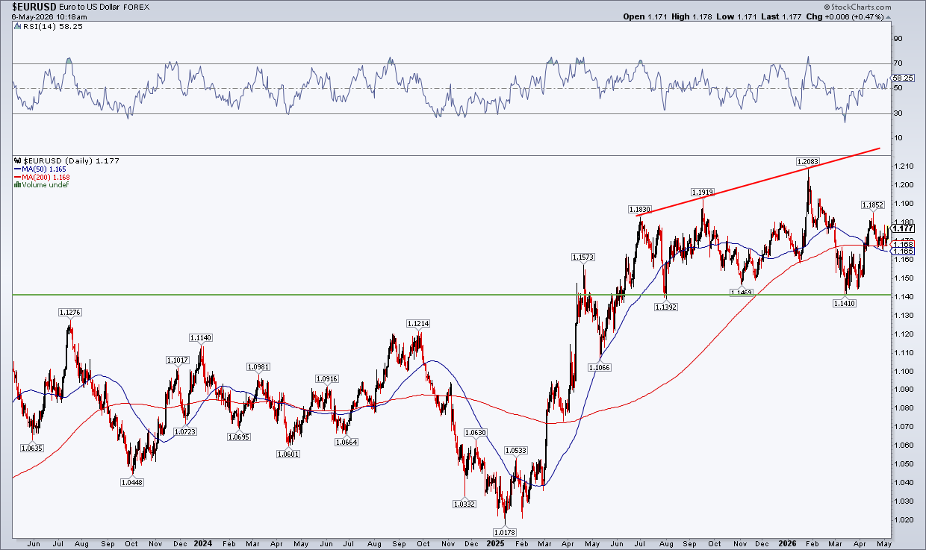
For traders, a rising euro could boost returns when paired with VGK. If the euro falls, a hedged European ETF like HEDJ might be a safer choice.
Bottom Line
Investors who spread their bets across many countries did well in 2025, but 2026 has been more uneven. While geopolitics keep shifting, the charts show that Europe could turn bullish after a few months of underperformance. Watching VGK for a breakout may signal a stronger global market.
Disclaimer: This content is for educational purposes only and does not constitute financial advice.
Source: Materials provided by https://articles.stockcharts.com.Note: Content may be edited for style and length.