
Technology Makes a Comeback
The S&P 500 barely moved this week, but the sectors underneath changed a lot. The biggest surprise is that technology is back in the top five sectors.
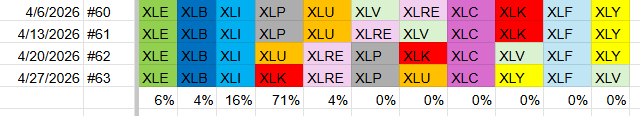
Current sector ranking (by weight) looks like this:
- Energy – 6 %
- Materials – 4 %
- Industrials – 16 %
- Technology – 71 %
- Real Estate – 4 %
- Consumer Staples
- Utilities
- Communication Services
- Consumer Discretionary
- Financials
- Health Care
Adding a heavy‑weight sector like technology changes how the whole portfolio looks. Technology now makes up 71 % of the total weight, pushing the other four sectors down to about half of what they used to be. Because of this, tech performance will decide whether the portfolio can catch up to the S&P 500.
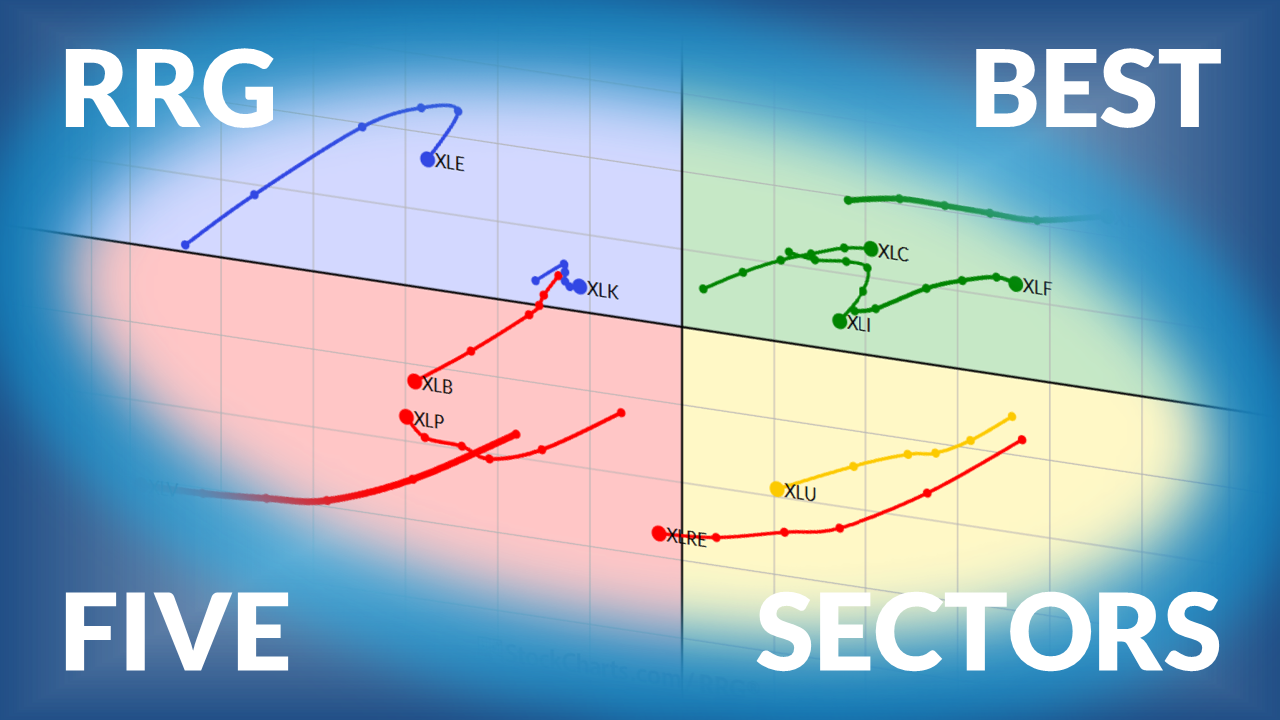
Weekly Relative Rotation Graph
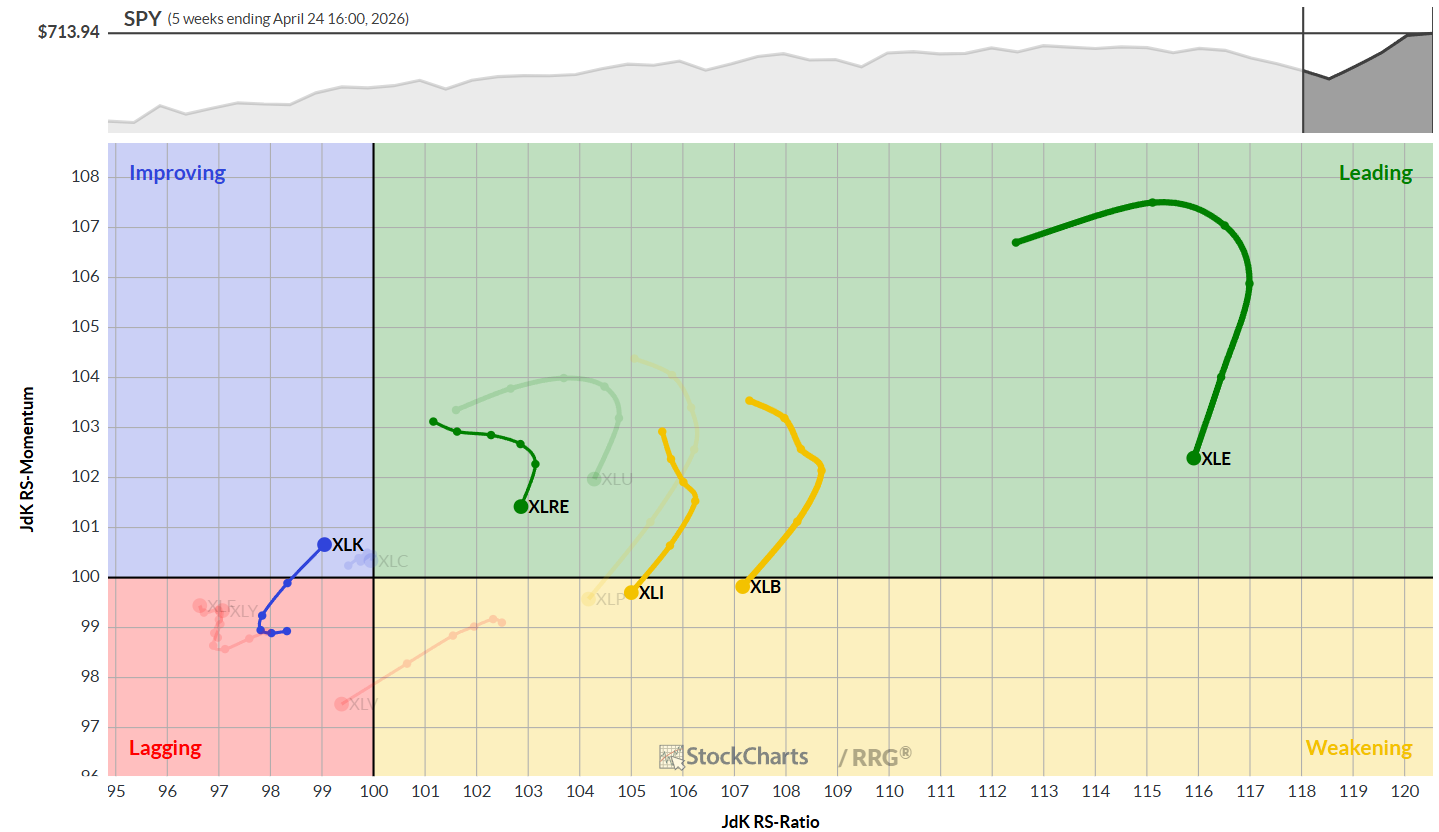
The weekly RRG shows four stable sectors – Energy, Materials, Industrials and Real Estate – moving along their usual paths. Energy and Real Estate stay in the strong‑performance quadrant, though they are slowing down. Materials and Industrials have slipped into a weaker quadrant but still hold decent strength.
Technology is moving fast into the “improving” quadrant. The distance the tech point travels shows its momentum is gaining speed.
Daily Relative Rotation Graph
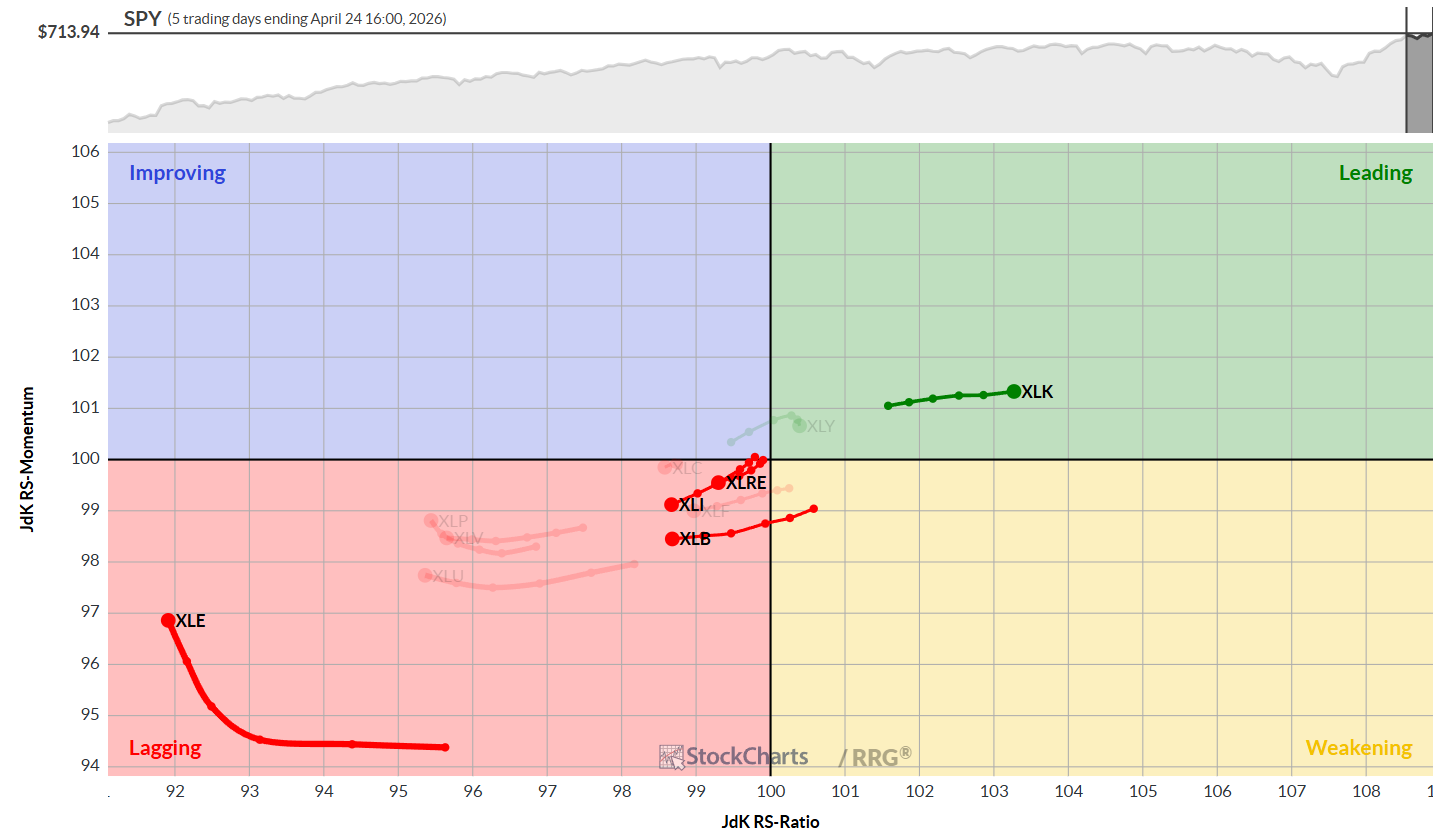
On a day‑to‑day basis, technology is the only sector racing to the right inside the strong‑performance quadrant. Consumer Discretionary also sits in that quadrant, but its growth has slowed. The other top sectors are in the lagging quadrant; energy is gaining a little, while the rest are losing strength.
Both graphs tell the same story: tech is back strong and is pushing other sectors aside.
Sector Highlights
Energy
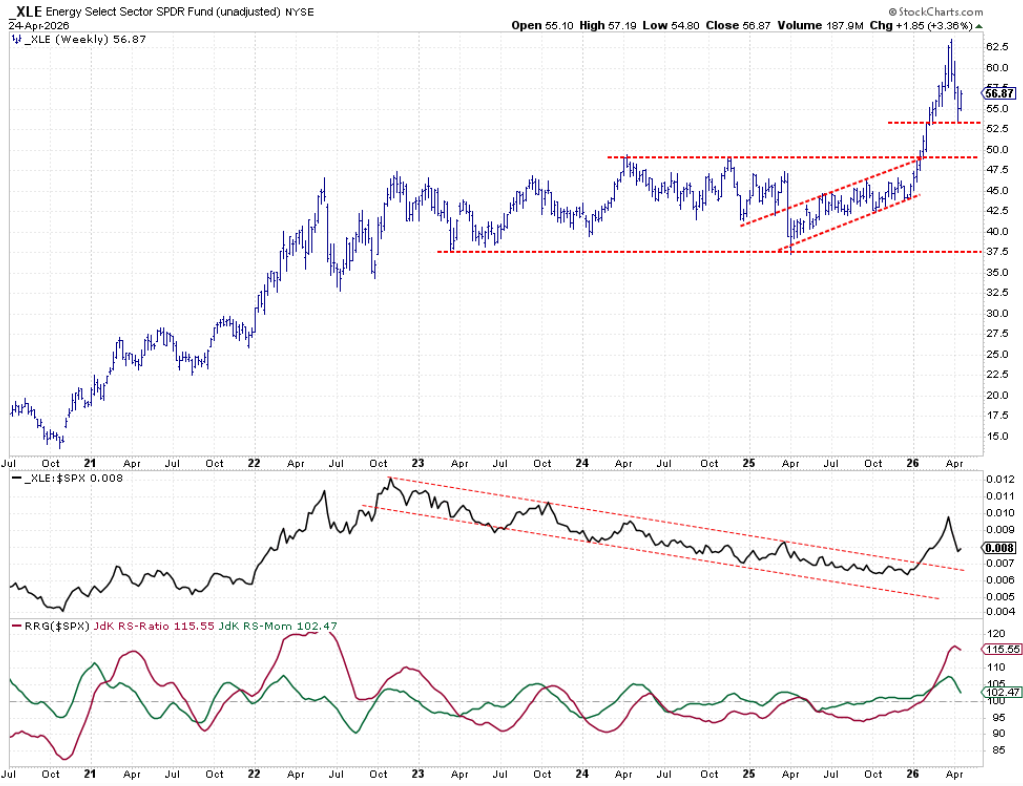
Energy is still strong. The price made a higher low around $53 and is climbing again. The strength line is steady, suggesting more upside could be coming.
Materials
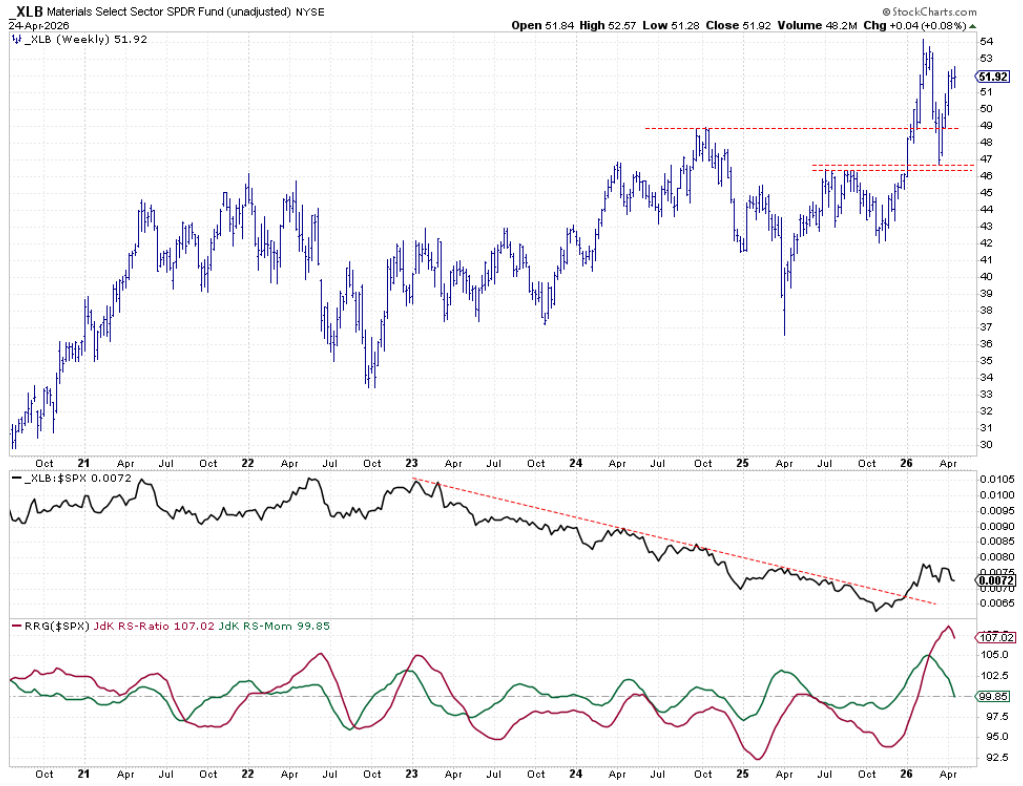
Materials have been quiet for three weeks. The price moves sideways, giving the strength lines time to catch up. If the price stays firm, materials can keep their top‑spot.
Industrials
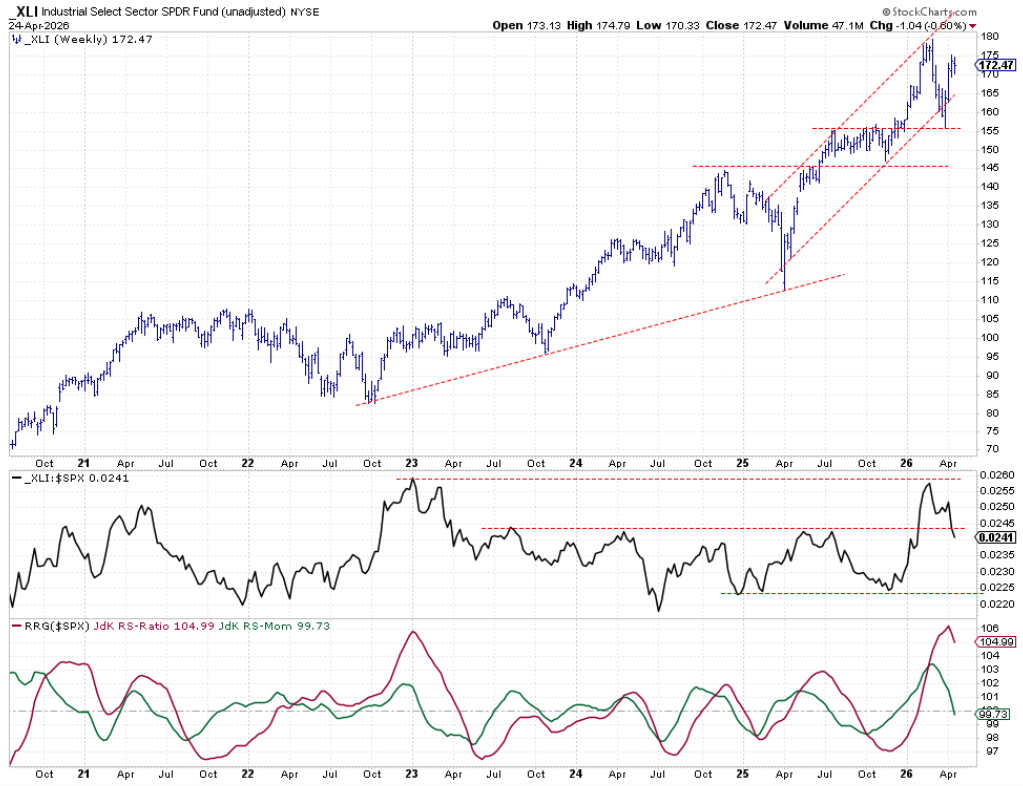
Industrials are still moving up, but the strength line shows lower highs and lower lows. This could push the sector deeper into a weak area unless momentum turns quickly.
Technology
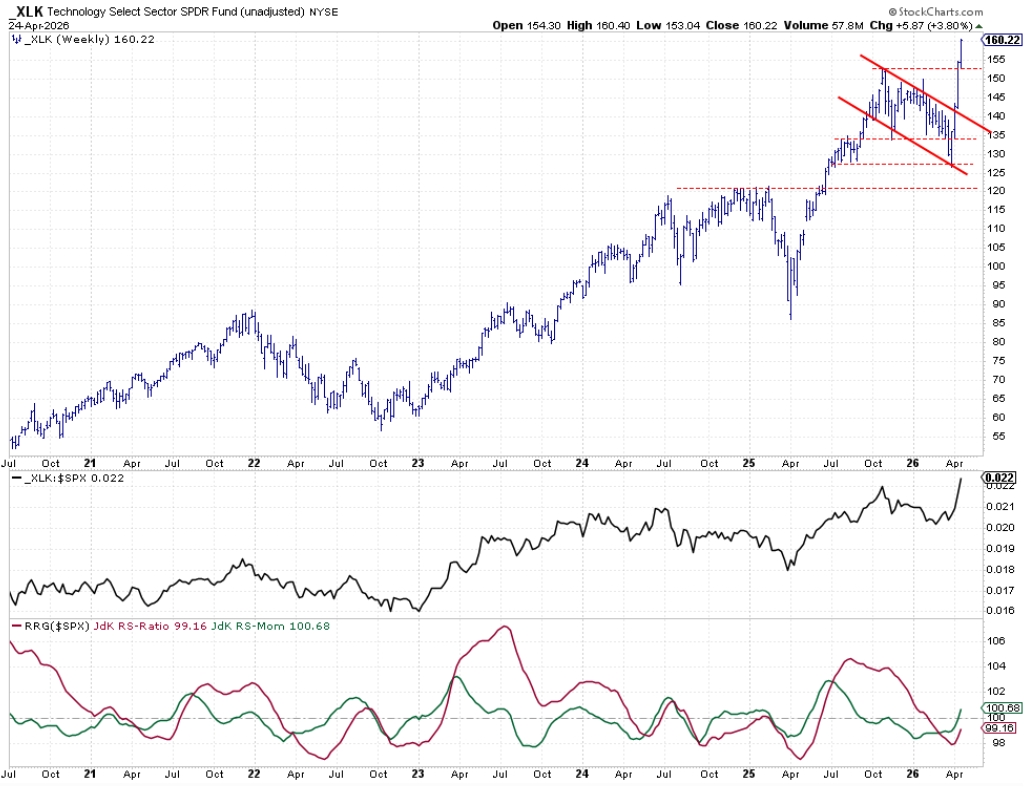
Technology is the star. The price jumped from about 130 to over 155 in three weeks, lifting the strength line to a new high. Both momentum lines point upward, and tech is almost entering the leading quadrant on the weekly map.
Real Estate
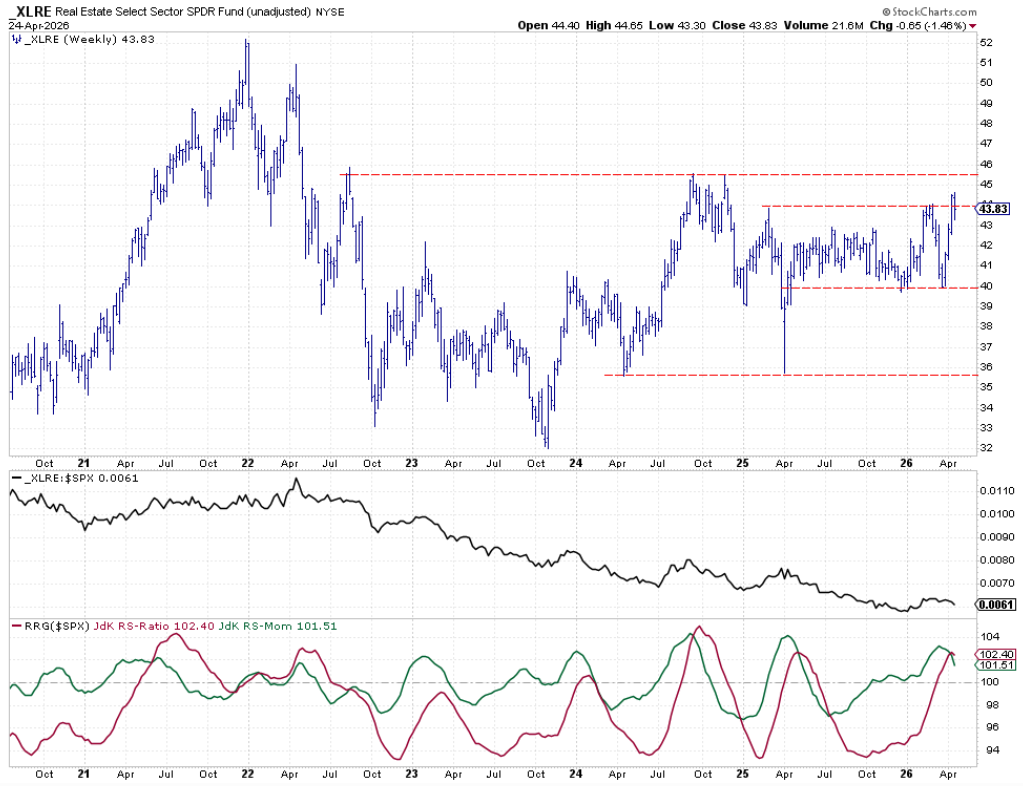
Real Estate is fighting to stay above the breakout line at 44. The price has stalled, and the strength line is flat. The sector is still in the strong‑performance quadrant but is losing steam and may drop out of the top five soon.
Portfolio Performance
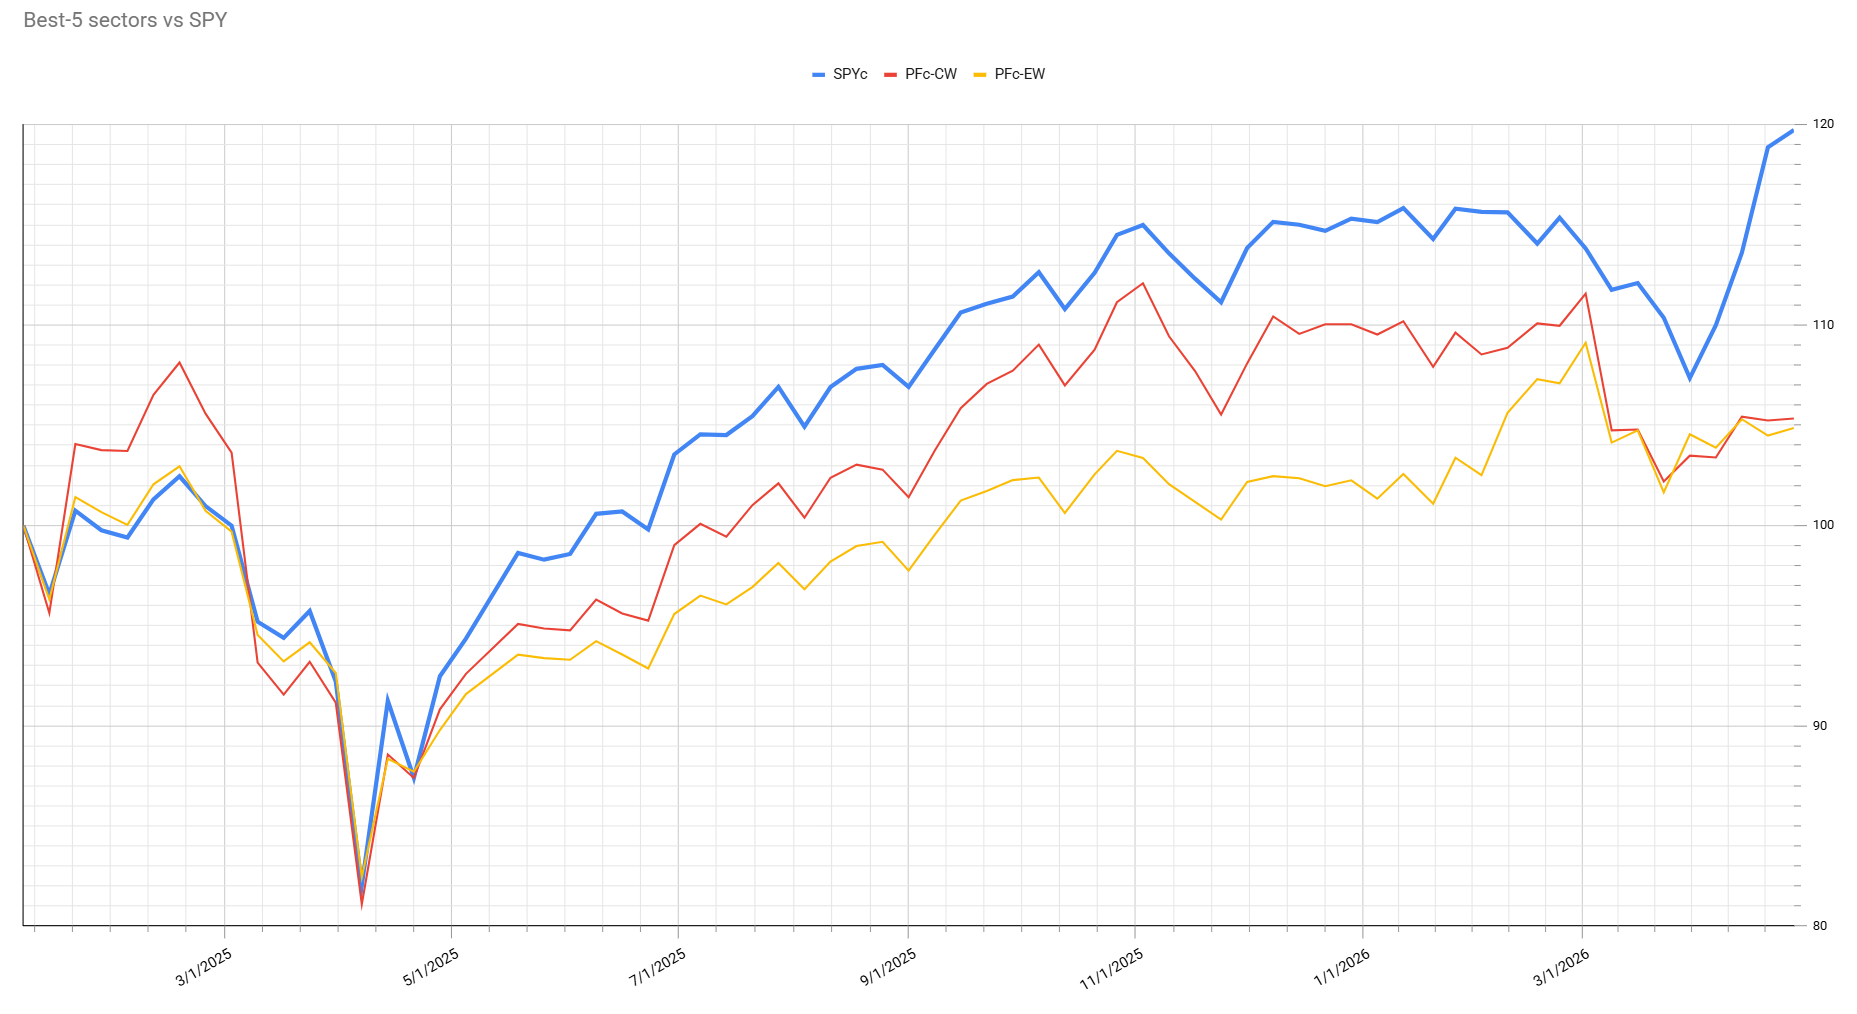
The portfolio is still about 13 % behind the S&P 500. Recent market swings have erased some of the gains the portfolio made when it almost caught up.
For the portfolio to keep up, it needs a long period of steady sector rotation. With technology back in the top five, the weightings now follow market size, making XLK the dominant piece again.
Strategy Observations
Sector moves often happen mid‑week. Because the portfolio updates only once a week, it can miss quick gains. For example, technology entered the top five on April 22, but the portfolio didn’t reflect that until the next weekly update.
This isn’t an excuse—just something to watch. Ongoing research will keep improving the approach.
Bottom Line
Technology’s return to the top five reshapes sector weights and makes its performance crucial for closing the gap with the S&P 500. Sector rotation stays lively, and continued study will help fine‑tune the strategy.
Source: Materials provided by https://articles.stockcharts.com.Note: Content may be edited for style and length.