
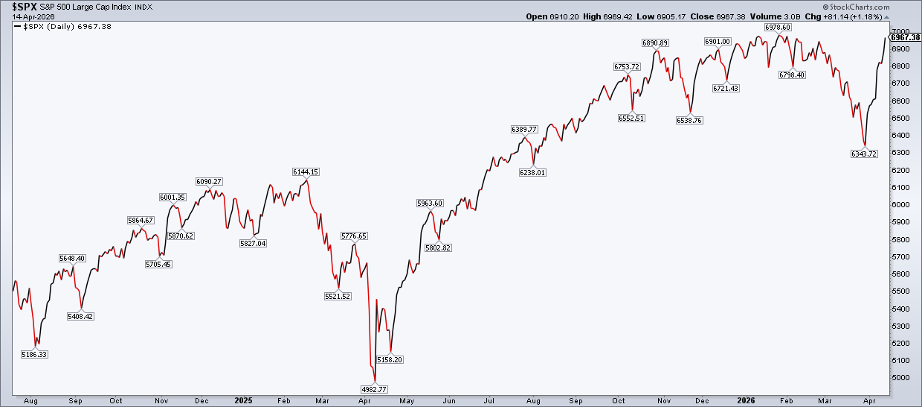
Another V‑shaped bottom has appeared on the big market chart.
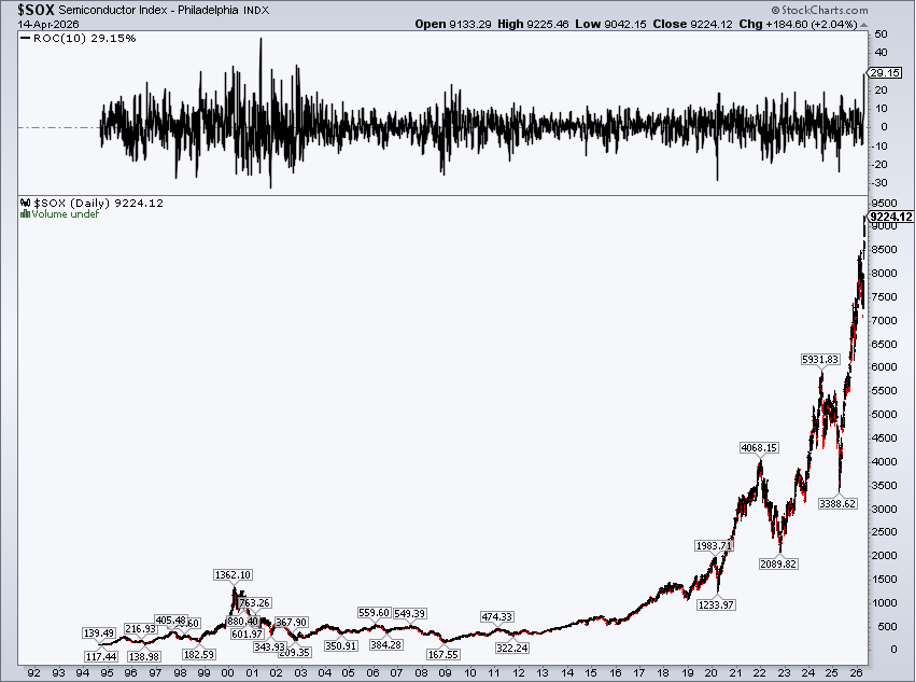
The S&P 500 climbed almost 10% in ten days, getting close to its record set on Jan. 28. The Nasdaq Composite jumped about 14% in the same period, one of its best moves since 2009. Even the Philadelphia Semiconductor Index surged a staggering 29% – a rise not seen since 2002.
Semiconductors Lead the Charge
Chip makers posted eye‑popping gains in April: NVIDIA +12%, Taiwan Semiconductor +14%, Broadcom +27%, Micron +35%, AMD +25% and Intel +45%.
The VanEck Semiconductor ETF (SMH) has risen for ten straight sessions and is the first big‑cap sub‑index to hit a fresh all‑time high.
Risk‑On Momentum Across Sectors
When we look at sector ETFs, technology (XLK) has been the strongest, up about 16% since late March. Industrials (XLI) and Consumer Discretionary (XLY) also beat the S&P 500 ETF (SPY). Energy (XLE), Consumer Staples (XLP), Utilities (XLU) and Health Care (XLV) lag behind.
In plain terms, growth‑oriented stocks and AI‑related names are pulling the market higher, while defensive and low‑price‑oil stocks are falling out of favor.

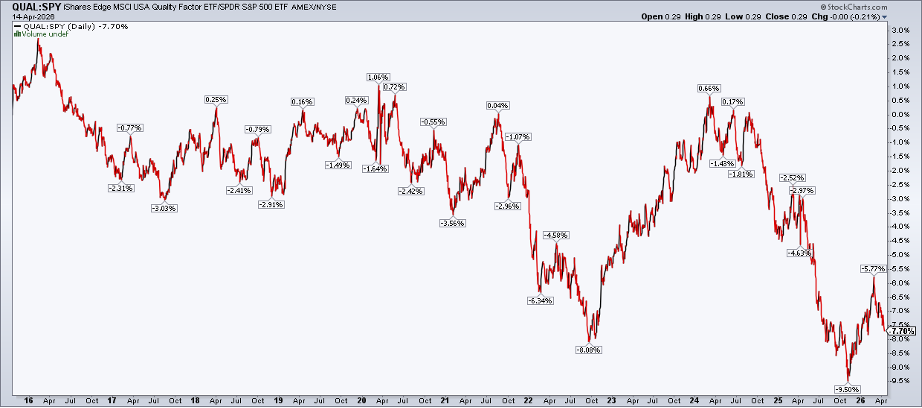
Quality Stocks Lose Their Edge
Funds that focus on "quality" have started to fall behind the market. The iShares Edge MSCI USA Quality Factor ETF (QUAL) used to out‑perform, but its rally has stalled and it now trails the S&P 500.
A ten‑year view shows QUAL peaked, fell to a low last November, and has only made a modest comeback. The recent dip suggests the factor is losing its shine.
Reading the Rotation with RRG
The Relative Rotation Graph (RRG) shows where each factor stands. QUAL is moving into the "Weakening" zone, while other factors sit in the stronger, upper‑right area.
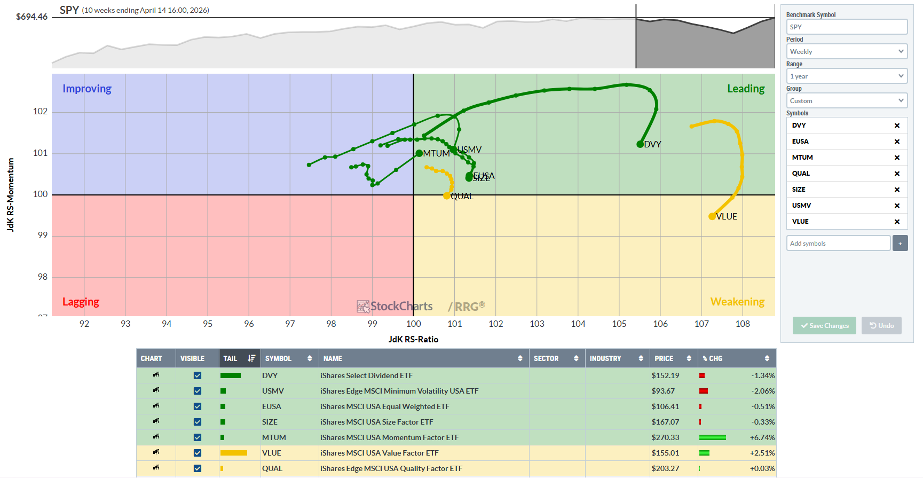
This pattern tells bulls that risk‑on assets are gaining power, even though the market as a whole still looks broad.
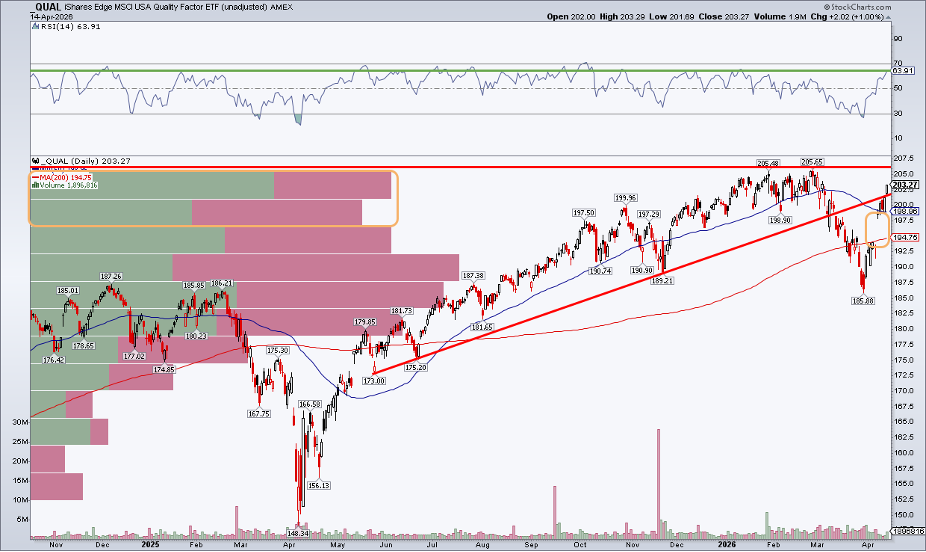
Technical Signs Back the Rally
On the price chart, QUAL is only about 1% away from its February high. It fell below its 200‑day moving average in March but bounced back above it early in April – a classic bullish sign.
A bullish engulfing candle appeared on Monday and was confirmed on Tuesday, hinting that the ETF could break to new highs.
What Could Hold the Move Back?
The Relative Strength Index (RSI) is at its strongest level in three months, but there is still a gap between $193‑$194 and a resistance line near $205. Traders should watch for strong selling pressure if the price stays below $205.65.
Bottom Line
Quality‑focused funds are still solid, but they are losing ground to higher‑risk, growth‑oriented stocks. This shift lines up with the strong sector performance we see today. While the market may be heading toward fresh S&P 500 records, investors should stay vigilant and manage risk.
Disclaimer: This article is for educational purposes only and does not constitute financial advice.
Source: Materials provided by https://articles.stockcharts.com.Note: Content may be edited for style and length.