
Before we start…
Many traders think a special edge comes from fancy tools. It really comes from a clear structure. A good structure lines up what you watch, the tools you own, and the steps you follow. When everything works together, you get an edge.
If your screen looks messy, you will react fast and guess. If your dashboard is tidy, you will act on purpose. Customizing your view is the first step to that tidy setup. It puts the important pieces where you need them before the market opens.
Quick tip: Think of customization as building a command center for your trades. Let’s set it up.
The Simple Tools to Tweak Your Dashboard
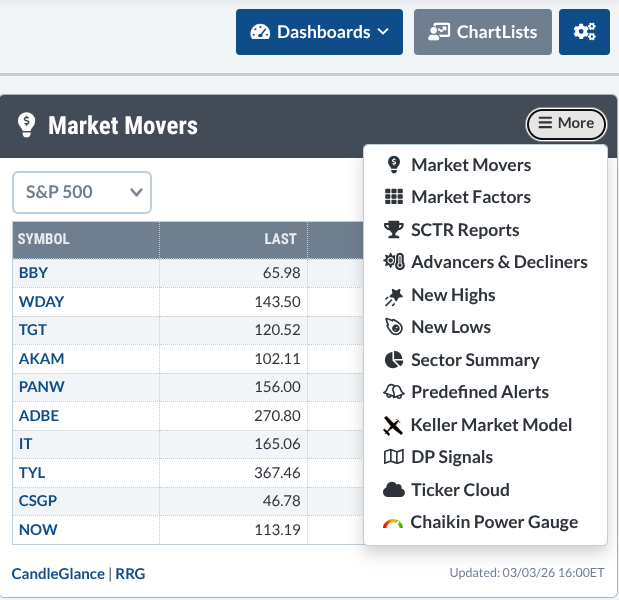
First, open the Dashboard. Look for the little settings icon at the top right and click it.
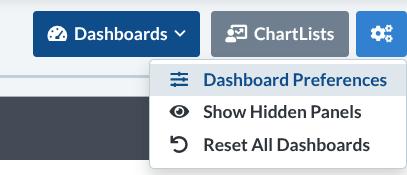
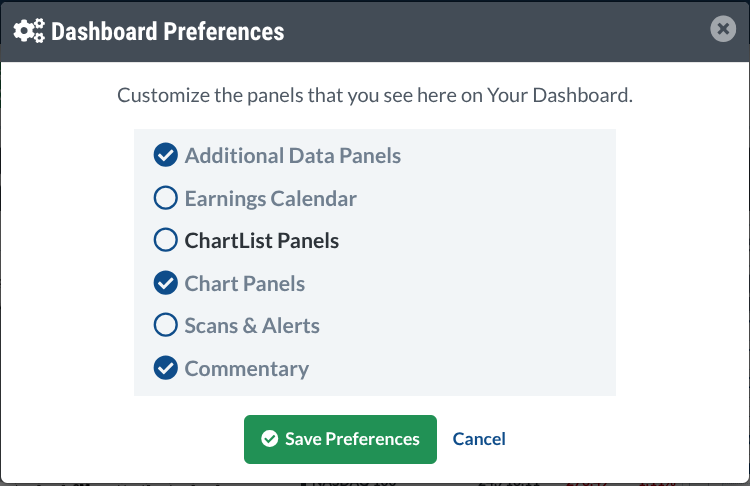
Next, choose Dashboard Preferences. This opens a control screen where you decide which panels show up.
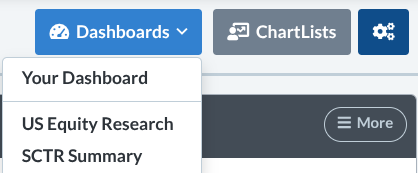
The menu also offers special views such as Equity Research and SCTR. Each view gives a different look at the market.
Inside each panel, a small menu at the top‑right lets you add or remove details.
Knowing what panels exist is only half the story. The real power is picking the ones that match your own timeline, strategy, and risk level.
Layout Idea #1 – Earnings‑Focused Trader
Best for traders who watch earnings reports first.
- Earnings Calendar
- Market Movers
- Sector Summary
- Chaikin Power Gauge
- Chart Panel (quick check)
Why it works: If earnings drive your trades, you need a radar that shows when companies report and which sectors are moving.
Layout Idea #2 – Pure Technical Trader
Best for traders who live by price action.
- Chart Panel (multiple time frames)
- SCTR Reports
- Scans & Alerts
- New Highs & New Lows
- Advancers & Decliners
Why it works: This setup keeps an eye on momentum, strength, key levels, and market breadth.
Layout Idea #3 – Relative Strength / Rotation
Best for traders who follow sector rotation.
- Sector Summary
- Market Factors
- Advancers & Decliners
- Chart Panel
- ChartList of leading stocks or ETFs
- SCTR Reports (optional)
Why it works: Think of it as a radar that shows where capital is flowing across sectors and styles.
Layout Idea #4 – Market Internals Tracker
Best for macro‑aware traders.
- Advancers & Decliners
- New Highs & New Lows
- Market Factors
- Chaikin Power Gauge
- Market Movers
Why it works: This view helps you watch how many stocks are moving up or down, giving clues about the market’s health.
Layout Idea #5 – Long‑Term Investor
Best for position traders and investors who think years ahead.
- Earnings Calendar
- Sector Summary
- Commentary Panel
- Chart Panel (weekly / monthly)
- Scans & Alerts
Why it works: It blends big‑picture fundamentals with long‑term chart trends, while alerts keep you aware of new opportunities.
Make It Your Own
Feel free to swap panels in and out. The goal is to add only what helps your trading plan.
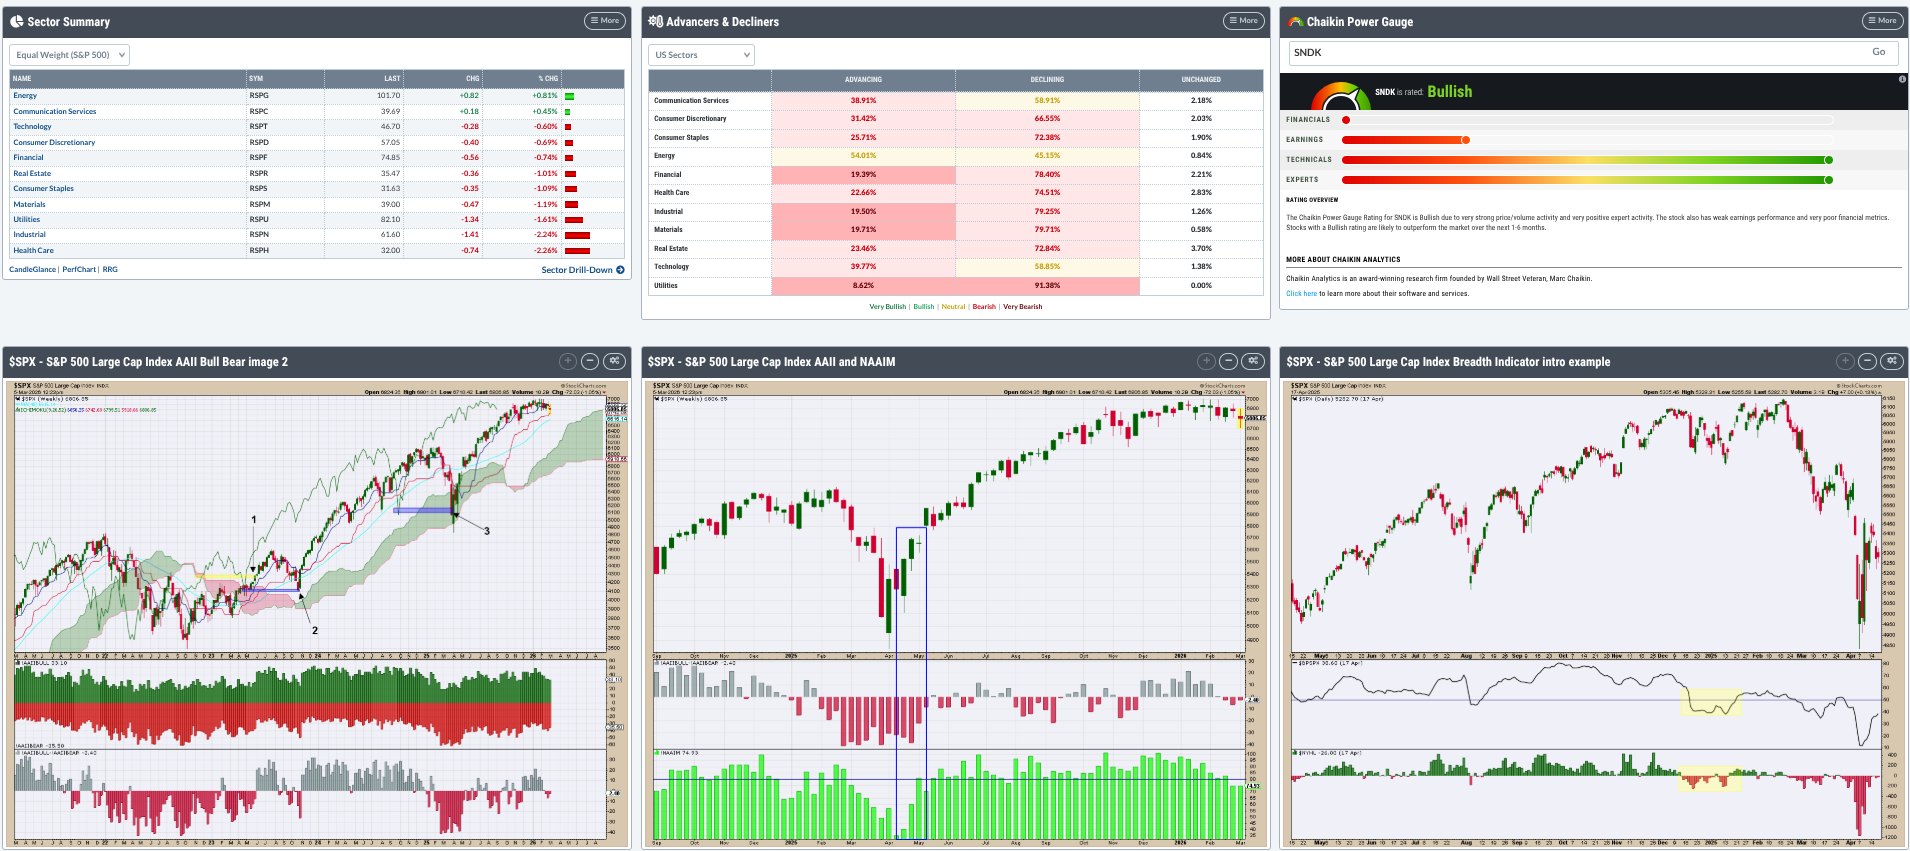
That picture shows a custom mix for someone who watches sector strength, breadth, and sentiment. Use it as inspiration, then build a view that feels right for you.
Final Thoughts
Your dashboard is more than a screen; it’s the engine that drives your choices. The panels you pick decide what information you see first. Experienced traders not only study the market differently, they also arrange their information differently. Your edge will grow when your structure matches your strategy.
Set up your layout before the market opens, and you’ll be ready to act with confidence.
Source: Materials provided by https://articles.stockcharts.com.Note: Content may be edited for style and length.