

The market bounced back sharply this week. NIFTY moved between 22,543 and 24,074 before ending near the top at 24,051. The India VIX fell from 25.5 to 18.9, a drop of about 26%.
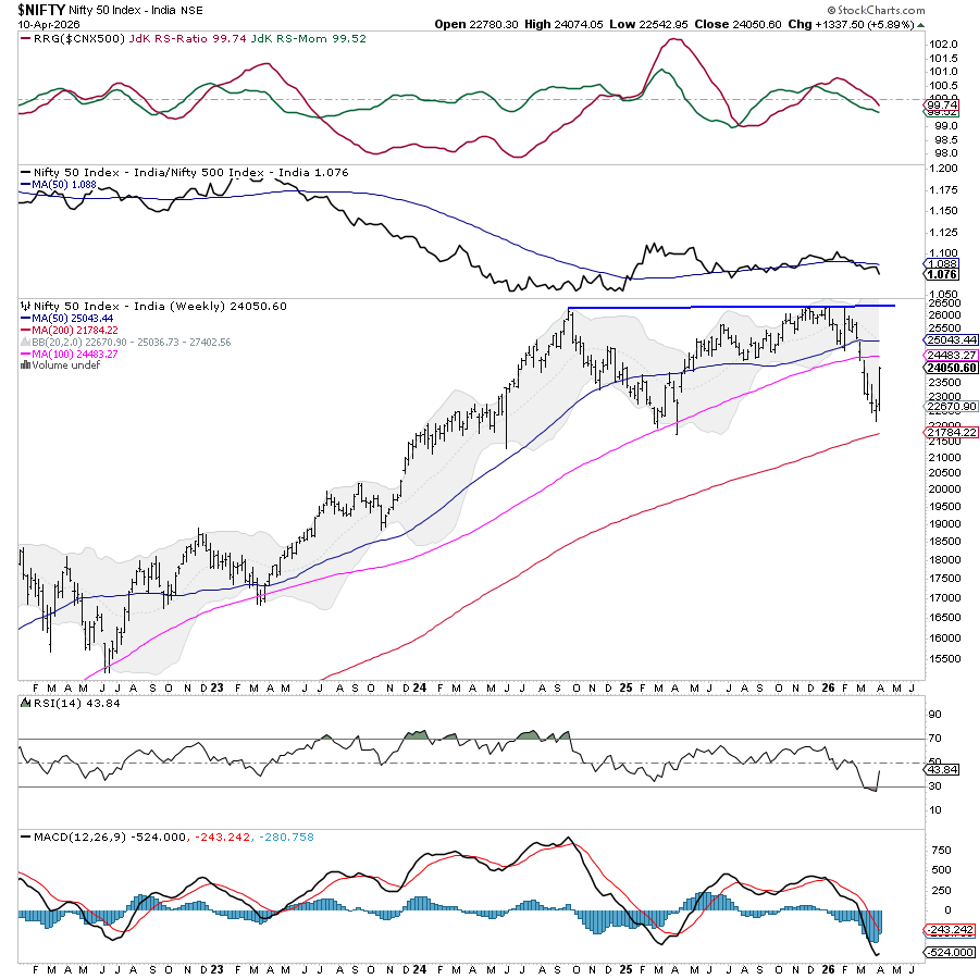
Even with the strong rise, NIFTY is still below important resistance levels. The 50‑week moving average sits at 25,043 and the 100‑week average at 24,484. Until the index moves above these zones, the trend is not fully restored.
If NIFTY stays under the 24,480‑25,050 band, traders may see profit‑taking and hesitation. A clear break above this range would improve the chart pattern, while a fall back could bring more volatility.
Next week is shortened because Tuesday is a holiday (Dr. Babasaheb Ambedkar Jayanti). Expect a cautious start with activity focused on individual stocks. Key resistance levels are around 24,485 and 24,625. Important support levels are near 23,700 and 23,400.
The weekly RSI is 43.8, below the neutral 50 line, showing modest momentum. The MACD is still under its signal line and both are negative, indicating that the overall momentum has not fully turned bullish yet.
Technically, NIFTY bounced after touching the lower Bollinger Band at 22,609 and stays well above the 200‑week moving average of 21,785. This keeps the long‑term trend intact, but the index remains under its medium‑term moving averages, so the rally needs confirmation.
For the coming week, focus on protecting gains rather than chasing every rise. Buy only strong stocks that show improving technicals or clear relative strength. Avoid chasing the index near its resistance zones, and stay disciplined with profit targets.
Sector Outlook for the Next Week
We compared several sectors to the CNX500 (NIFTY 500) using Relative Rotation Graphs. The graph shows how each sector moves relative to the broad market.
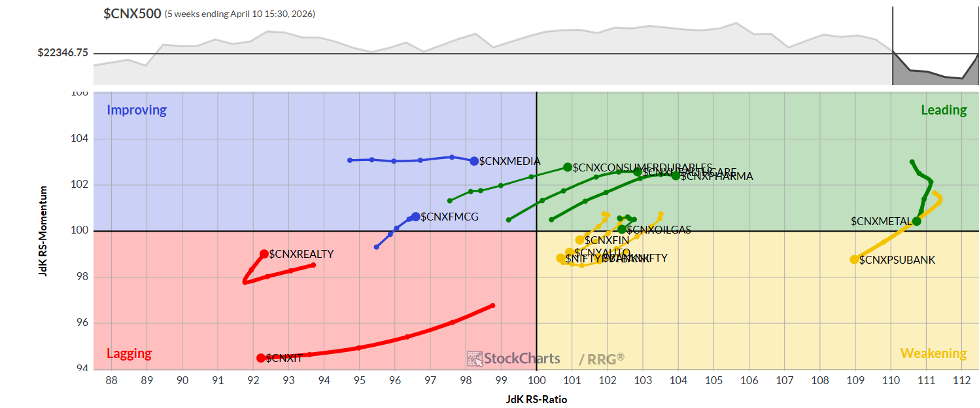
Energy, Mid‑Cap 100, Pharma, Public Sector, Metal and Infrastructure indices are in the leading quadrant, meaning they are likely to outperform the market. Metal and Public Sector show a slight slowdown but still stay ahead overall.
Public Sector banks, Bank NIFTY and Financial Services are in the weakening quadrant, suggesting possible deceleration. Auto is also there but is gaining momentum.
IT remains in the lagging quadrant, indicating underperformance. Services and Realty are also lagging, though Realty is showing signs of improvement.
Media and FMCG are in the improving quadrant, pointing to relative strength.
Note: Relative Rotation Graphs display relative strength and momentum against the NIFTY 500. They are not direct buy or sell signals.
Source: Materials provided by https://articles.stockcharts.com.Note: Content may be edited for style and length.