
CAC 40 Ends Day Higher
The French CAC 40 index finished the session at 8,259.60 points, a rise of 0.17% on strong trading volume. Over the past week the index is up almost 4%.
The Paris market moved into the green thanks to signs of calm in two key geopolitical areas: the Middle East and Ukraine. A recent interview with Ukrainian military intelligence chief Kyrylo Boudanov suggested progress toward a possible deal with Russia, highlighting a shared interest in ending the war.
Investors are also watching the aftermath of the two‑week cease‑fire agreement between Tehran and Washington. President Trump expressed optimism but warned the Islamic Republic of Iran about potential sanctions if it blocks shipping in the Strait of Hormuz.
Sector Highlights
- Luxury: Kering rose 0.73% to 276.45 and Hermès gained 0.34% to 1,757.5.
- Defense: Shares fell, with Thales down 3.36% at 259.2 and Safran down 0.85% at 313.3.
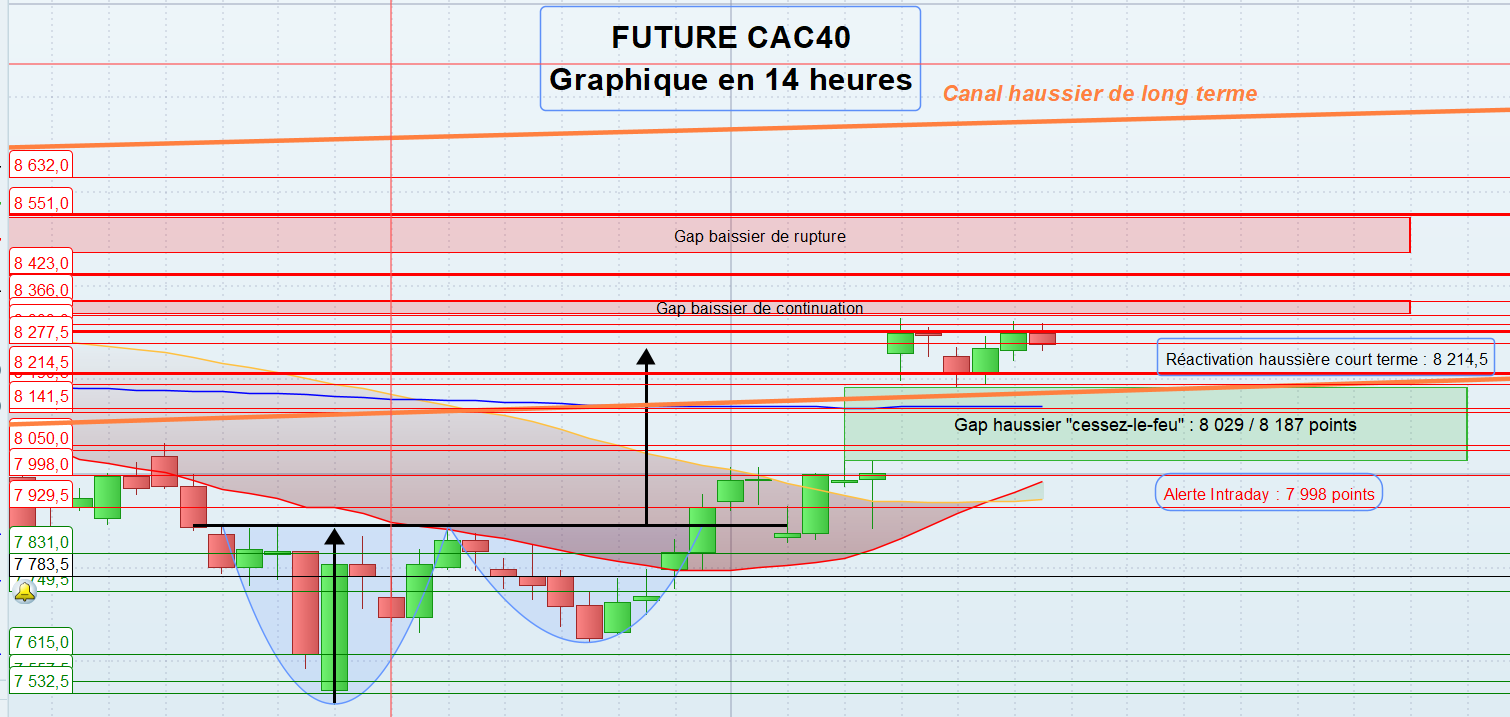
Technical Outlook for April Futures
Resistance levels: 7,929.5 → 7,998 → 8,050 → 8,062 → 8,131.5 → 8,190 → 8,214.5 → 8,277.5 → 8,303 → 8,338 → 8,366 → 8,423 → 8,551.
Support levels: 7,831 → 7,749.5 → 7,615 → 7,557.5 → 7,532 → 7,398.5.
The intraday bias is bullish above 8,214 points.

Chart Interpretation
The CAC 40 futures reacted positively to the diplomatic news, letting buyers take the lead. Technically, the gap that opened on March 7 has not been filled, which many traders see as a confidence signal.
If the index pushes through the first resistance zones at 8,303, 8,319 and 8,338, it could close the continuation gap between 8,336 and 8,358. A later move toward the longer‑term gap (8,473.5‑8,544) would support a continued uptrend.
Conversely, a drop below the bullish channel and the “cease‑fire” gap could signal weakening momentum. A fall toward 8,029 would likely be a short‑term consolidation, while a break below 7,998 might open a deeper correction toward 7,892 and then to the next supports at 7,557.5 and 7,398.5.
Indicator Snapshot
- Price is above the 20‑, 50‑ and 200‑day moving averages.
- MACD histogram is rising above the signal line.
- RSI is in overbought territory.
- Trading volume is lower than the previous session.
Takeaway
Today’s move helped lock in part of the gains in two model portfolios, keeping their performance ahead of the benchmark. We remain watchful for any changes in the gap‑filling pattern, which could create fresh arbitrage chances.