


After a rough stretch, the market is showing a few green shoots. Could this be the turn investors have been hoping for?
Earlier this week, many thought the conflict in Iran might end soon. After a speech on Wednesday night, that hope faded. Oil prices rose before the market opened and stocks slipped. During the regular session, however, the S&P 500 and Nasdaq bounced higher and ended a five‑week losing streak.
That looks positive, but we need to look deeper to know if the rally is solid.
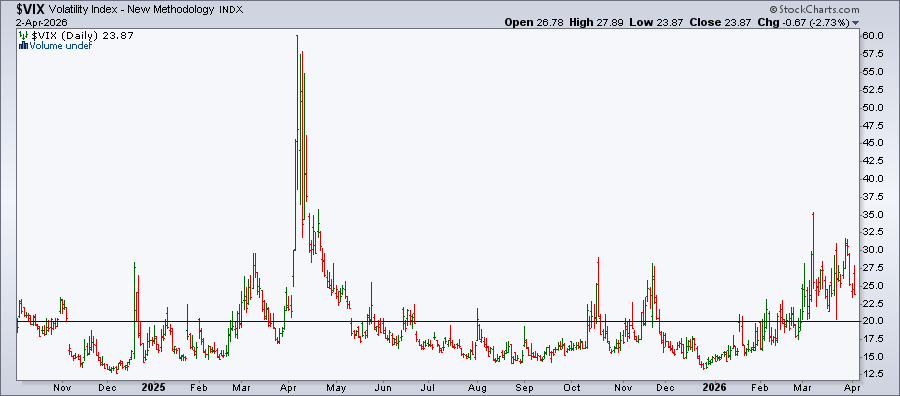
The CBOE Volatility Index (VIX) fell back to 23.87. Investors are less scared, but the level is still above the comfortable 20‑point mark.
Uncertainty about the bigger economic picture remains. The short‑term rally may look like a turn, yet the major indexes have not broken key resistance levels. Until they do, staying defensive is wise.
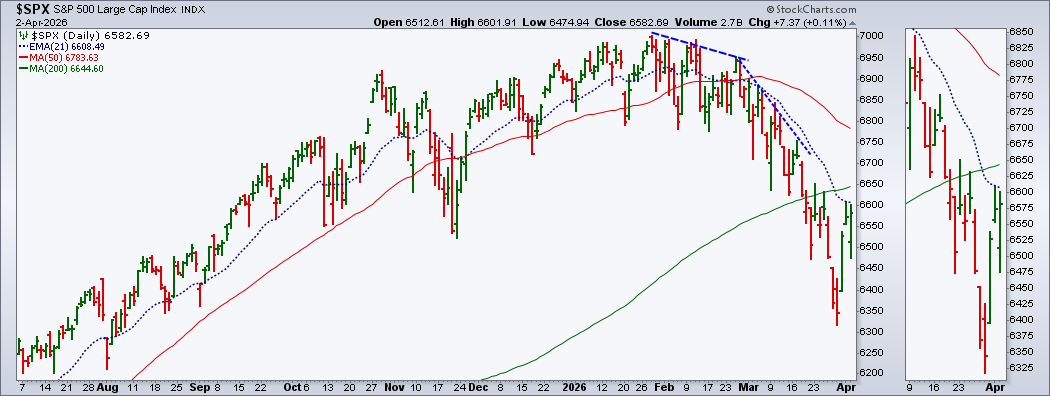
S&P 500: Gaining Ground, Still Below Key Trend
The S&P 500 has climbed more than 4 % from its low on March 30, but it is still under its 200‑day simple moving average. On the daily chart, the 21‑day exponential moving average acts as a strong ceiling. The index is trying to find stable ground but still leans downwards.
Nasdaq Composite: Facing Similar Barriers
The Nasdaq is in a comparable spot. It trades below its 200‑day average and meets resistance at the 21‑day EMA. An encouraging sign is that it touched the 38.2 % Fibonacci retracement before turning up.
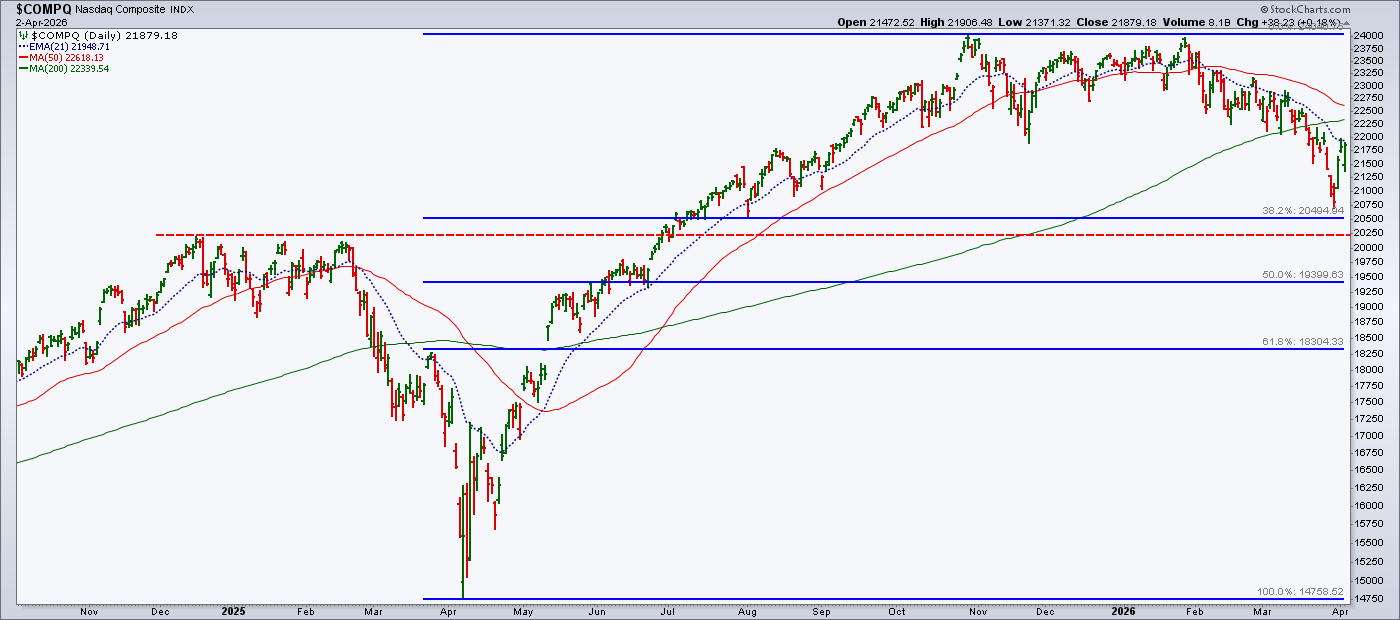
If the Nasdaq can break above both the 21‑day EMA and the 200‑day average, the next move could be higher. If not, it may slip back toward the 38.2 % level or lower.
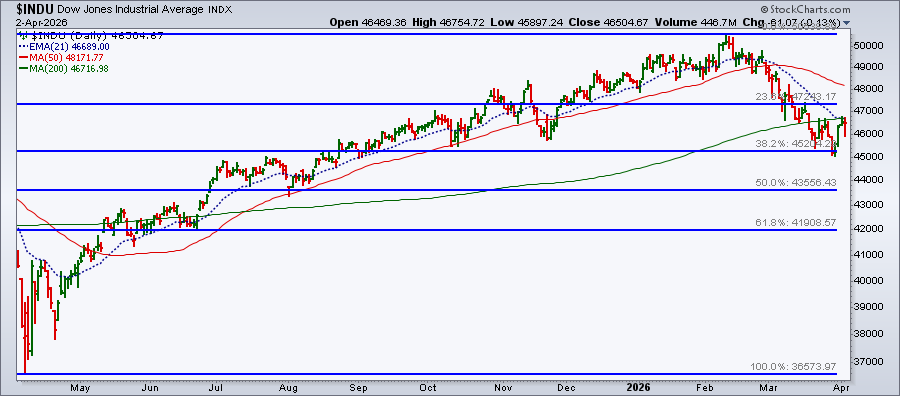
Dow Industrials: Same Story
The Dow also bounced from its 38.2 % Fibonacci level but now meets the 200‑day average and 21‑day EMA. A break above these lines is needed for a clear upside.
All three major indexes are sending the same message: the larger trend still needs improvement.
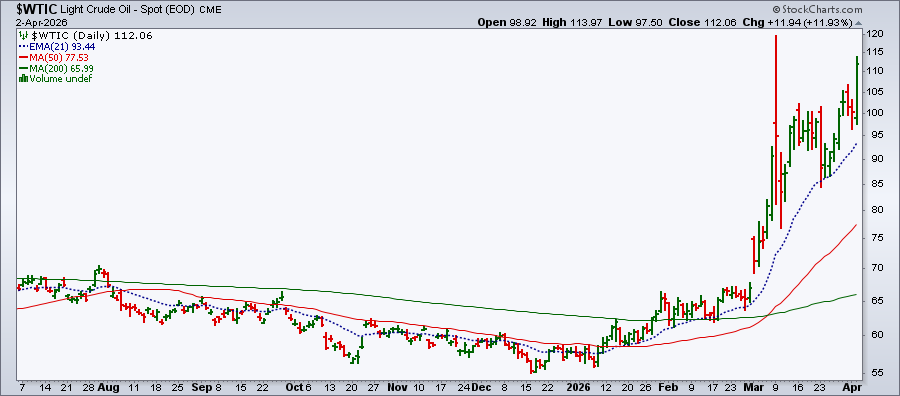
Oil Prices Keep Pressure on Stocks
High oil prices continue to weigh on equities. Spot Light Crude closed around $112 per barrel, a very high level. A sudden 11 % jump in the West Texas Intermediate price shows how sensitive markets are to Middle‑East tensions.
Even though the S&P 500, Nasdaq, and Dow ended a five‑week losing streak and posted strong weekly gains, the risk is not gone. Until the VIX settles near 20 and the charts show a clear upside reversal, it is better to avoid opening new long positions.
Watch the overall direction of the major indexes, keep an eye on support and resistance levels, and monitor volatility. When those signals turn green, you can start looking at individual stocks or ETFs to add to a portfolio.
Disclaimer: This content is for educational purposes only and does not constitute financial advice. Always evaluate your personal situation or consult a professional before acting.
Source: Materials provided by https://articles.stockcharts.com.Note: Content may be edited for style and length.