
In this article we look at a study that asks if market breadth can point out when the S&P 500 changes direction.
Using the Bullish Percent Index for Strong Trading Signals
The S&P 500 is weighted by market value, so big companies can hide weakness in smaller stocks. Market breadth counts how many stocks are strong versus weak. The Bullish Percent Index (BPSPX) does this by using point‑and‑figure charts, which only care about price moves, not time.
How the Indicator Works
Each stock is either showing a buy signal on the point‑and‑figure chart or it isn’t. This binary view cuts out a lot of daily noise that can fool moving‑average tools.

30‑Year Probability Study
By running custom scripts, four key BPSPX levels were tracked. The later performance of the S&P 500 was measured over periods from five days up to a year.
Signal Performance Overview
The Bullish Side: Why Recovery Matters
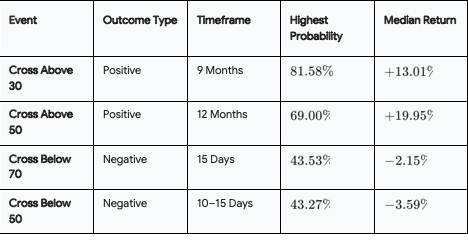
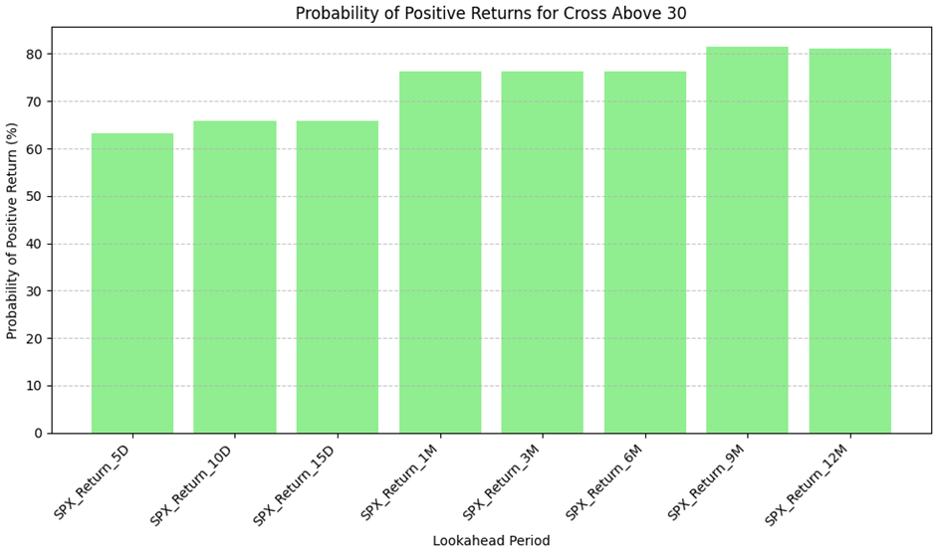
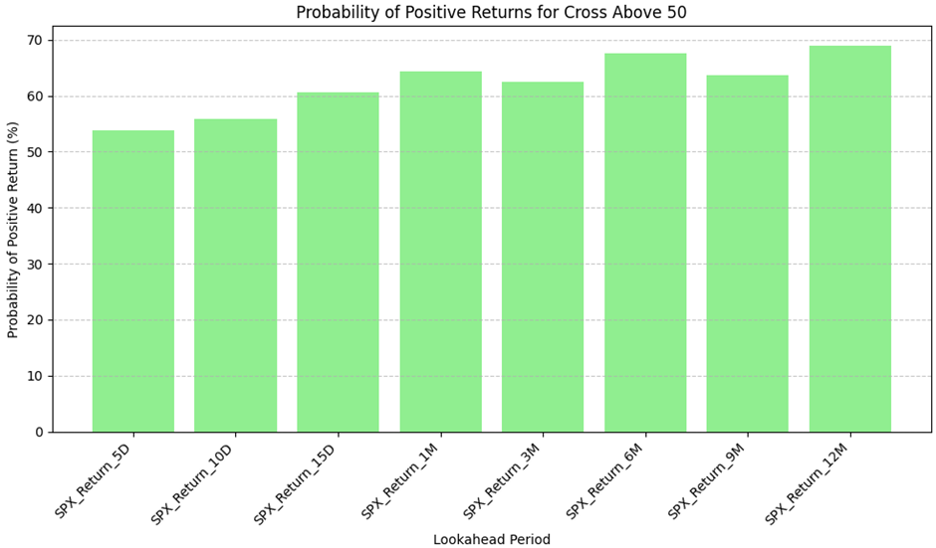
When the BPSPX climbs above 30, it often signals a real bounce. The 30‑level moves give more consistent results than the 50‑level, even though the 50‑level can show a slightly higher median return after a year.
Top Bullish Signals
- Cross Above 50 (12 M): 19.95% median return, 69% chance
- Cross Above 30 (12 M): 19.71% median return, 81% chance
- Cross Above 30 (9 M): 13.01% median return, 82% chance
The Bearish Side: Spotting Real Declines
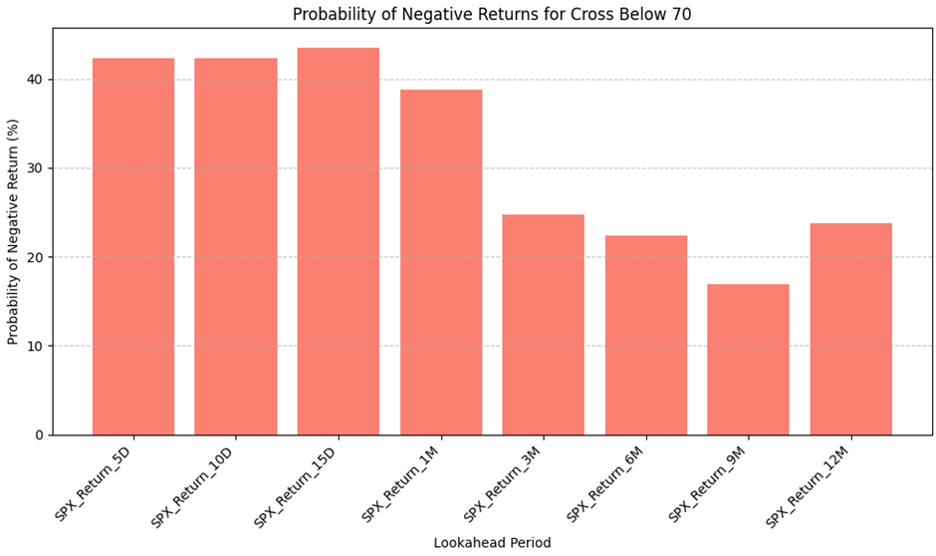
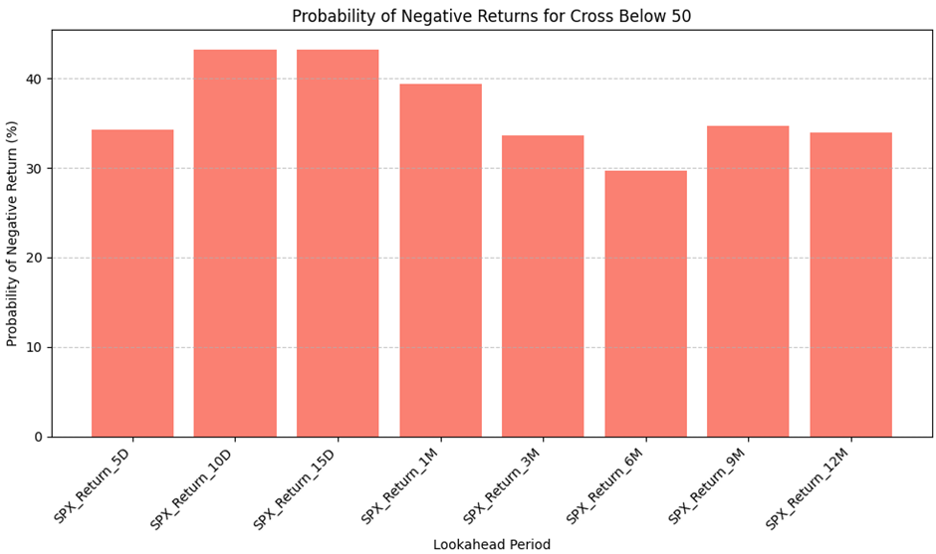
Downward signals are harder to predict, but they can be powerful. Falling below 70 is usually a mild cool‑down. Dropping under 50, however, often leads to a strong drawdown.
After a cross below 50, the S&P 500 showed an average 12‑month loss of about 14%.
Top Bearish Signals
- Cross Below 50 (12 M): –14.01%
- Cross Below 50 (9 M): –11.49%
- Cross Below 70 (9 M): –10.36%
Recent Example in Early April
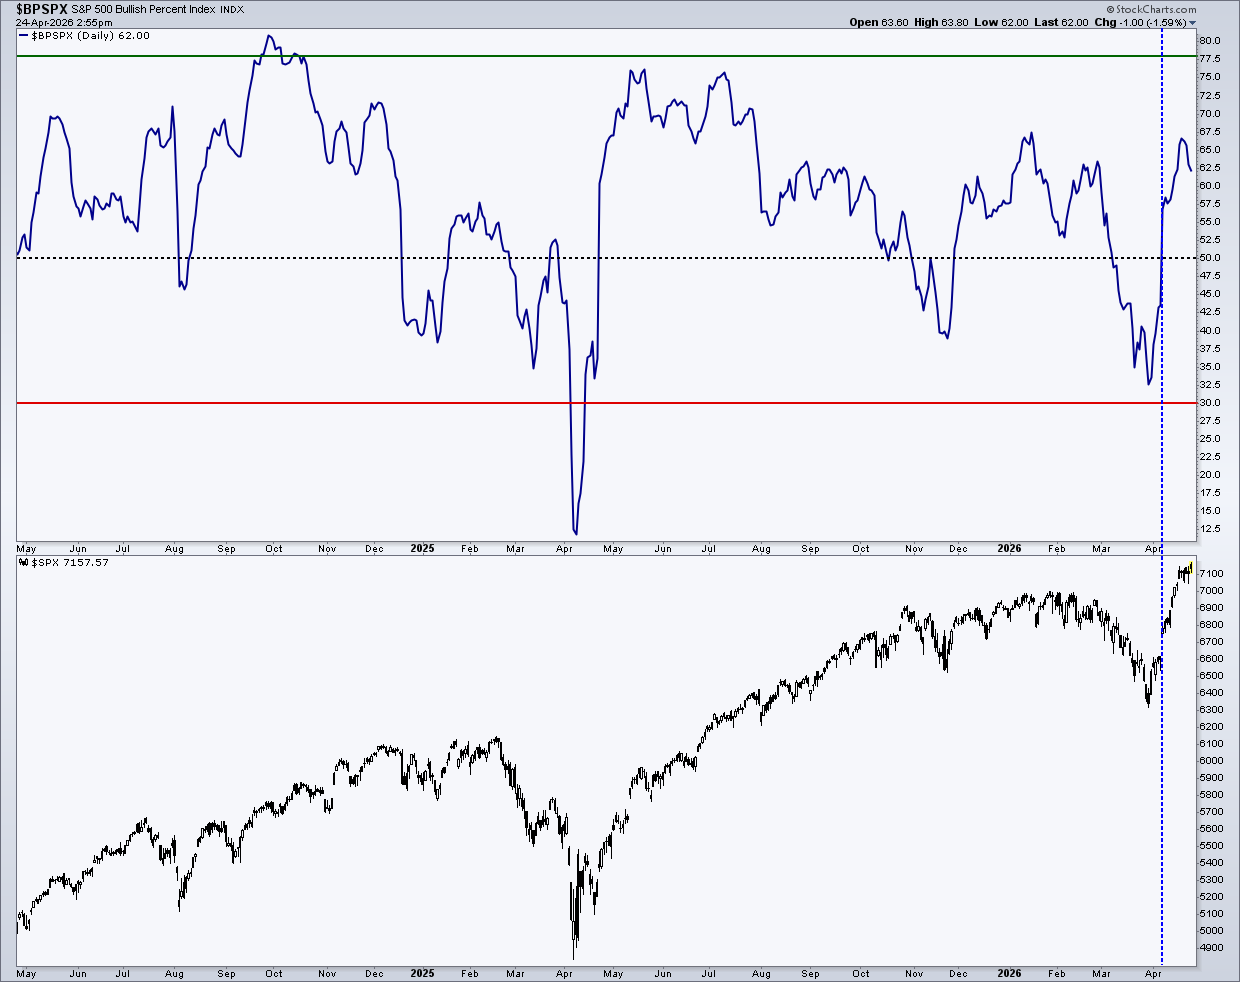
On April 8, 2026 the BPSPX crossed above 50. The S&P 500 has already risen more than 5% since that day. Historical data says a cross above 50 carries a 69% chance of delivering roughly a 20% gain over the next year.
A Patient Trading Framework
The BPSPX shows that patience can be a measurable advantage. Signals above 30 often need several months to show their full effect. By watching market breadth, traders can see whether the market has real strength behind the headline numbers, even when a few big stocks dominate.
Source: Materials provided by https://articles.stockcharts.com.Note: Content may be edited for style and length.