
 Today's brief looks at why we still think the market is in a bull phase and shows the key signals for the industrial (XLI) and material (XLB) sector ETFs. Both funds showed strength in March and broke out in early April, ending their short corrections.
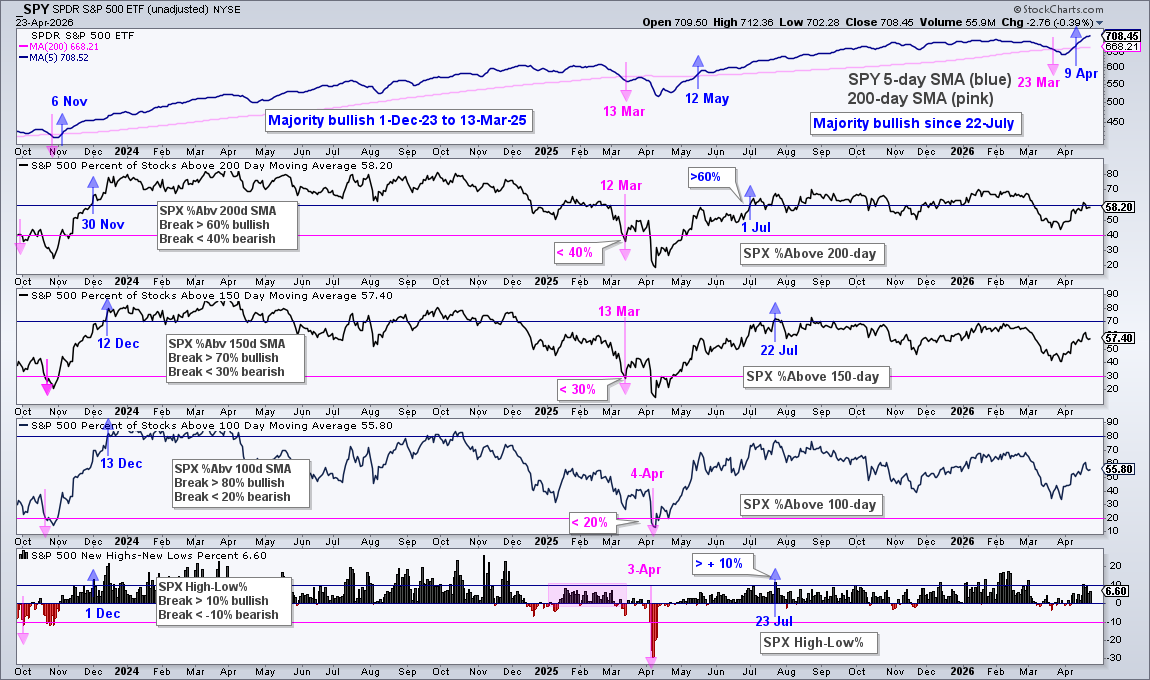
Bull Market with a March Correction
To trade a pullback, two things must be true. First, the overall market must be bullish. Second, the ETF must be in a long‑term uptrend. Our market‑breadth model stayed positive throughout March, so the drop that month was only a correction inside a larger bull market.
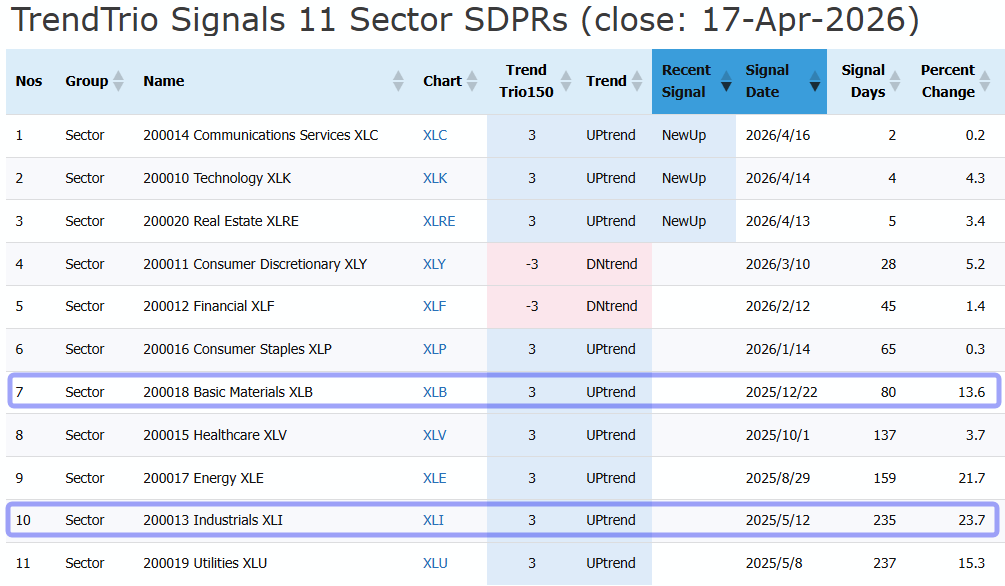
Long‑Term Uptrends Held in March
The Trend Trio150 indicator kept a bullish signal for both XLI and XLB during March. This tool looks at several momentum factors and turns green when the price is in a solid uptrend.
Finding the Bullish Setup Zone
The chart below shows XLI bouncing off a "Bullish Setup Zone". Three things line up here:
- A broken resistance level that now acts as support.
- The price returning to the rising 200‑day simple moving average.
- A 61.8 % Fibonacci retracement line.
When these three factors meet, traders watch for a reversal.
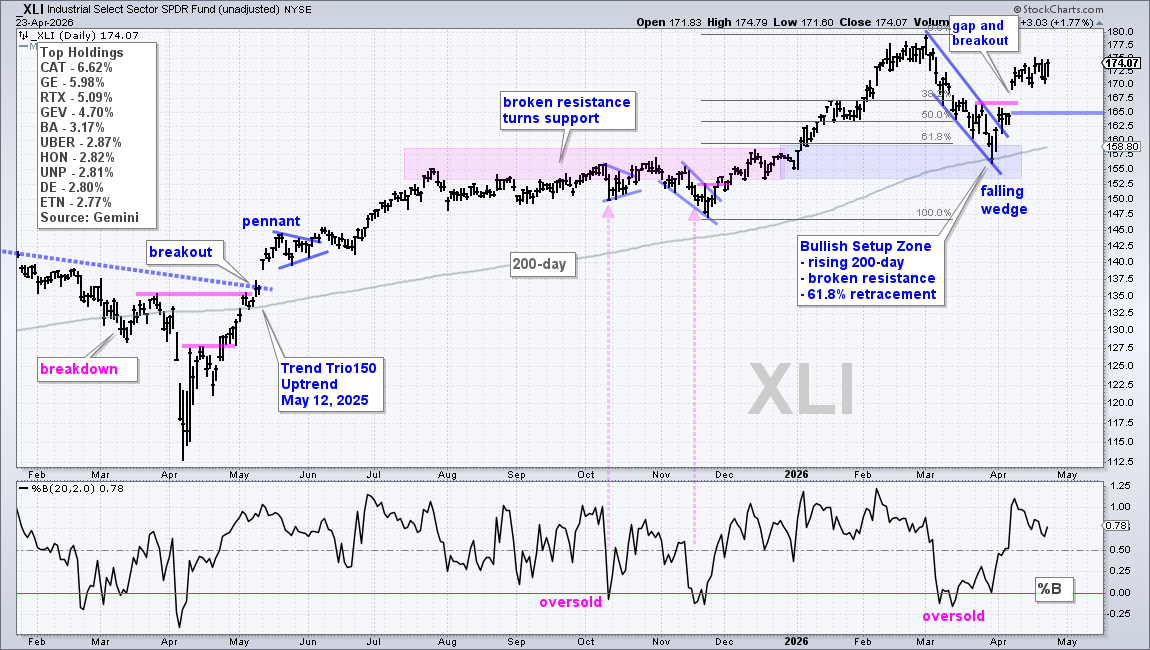
The %B indicator also fell below zero in March, showing a short‑term oversold condition. This often hints that a bounce could be coming.
Confirming the Move with an Upside Breakout
Pullbacks inside a larger uptrend often form a falling wedge pattern. The wedge gives a clear resistance line to watch. XLI broke out of its wedge in early April and then opened higher on April 8, creating a gap‑surge.
That gap‑surge is the key test. If the price stays above the breakout level, the uptrend is likely to continue. A close below 165 would suggest the breakout failed and a new assessment would be needed.
The same pattern appeared in XLB, as shown below.
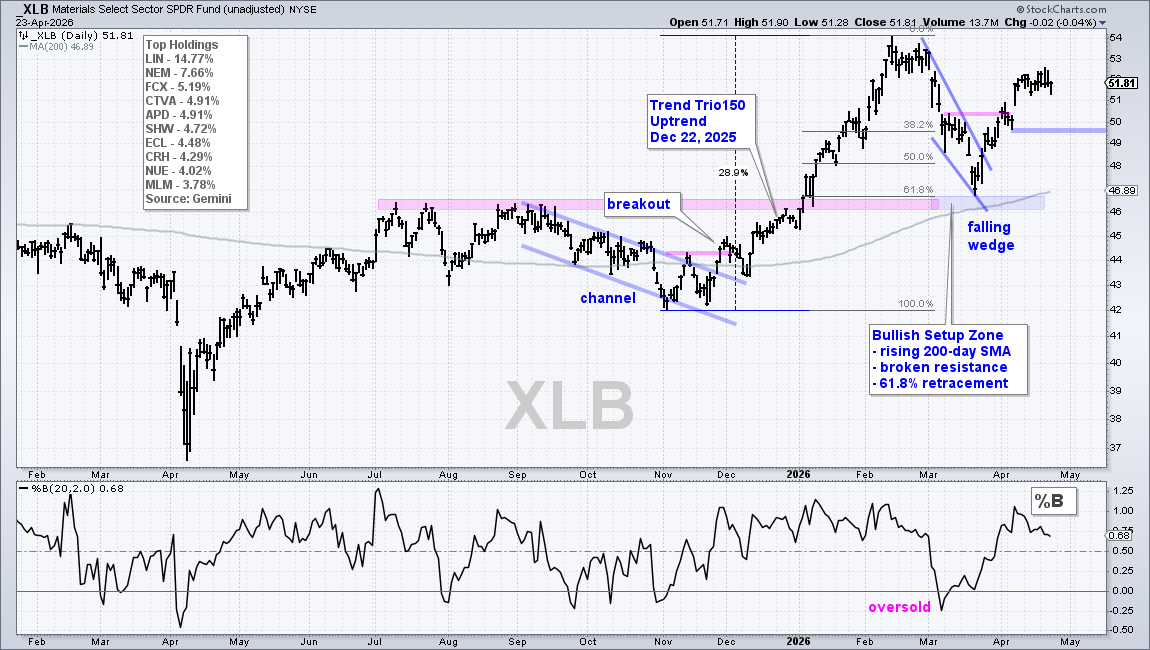
By watching for these three technical clues—support from broken resistance, the 200‑day SMA, and the Fibonacci level—traders can spot reliable pullbacks and join the next move in strong sector ETFs.
Source: Materials provided by https://articles.stockcharts.com.Note: Content may be edited for style and length.