


Are investors becoming too nervous? Several market gauges are pointing to growing doubt as global tensions rise.
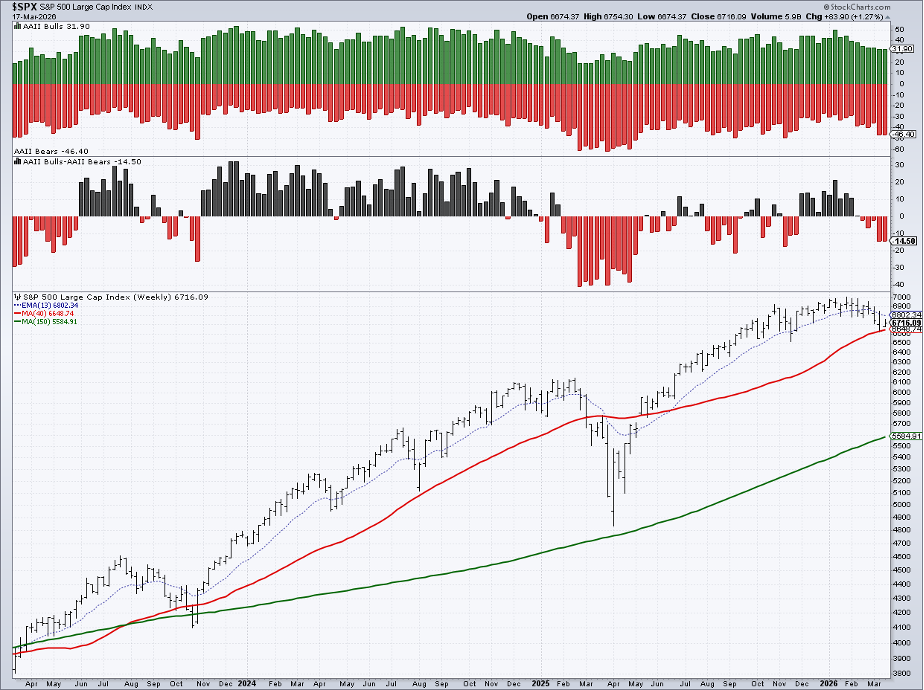
Survey Shows More Bears
The latest AAII Investor Sentiment Survey recorded 46 % of respondents as bearish, while only about 32 % felt bullish for the next six months. Fewer than 22 % said the current volatility created a buying chance.
Cash Levels Rise
Bank of America’s Global Fund Manager Survey revealed that managers added cash to their portfolios at the fastest rate since 2020. Though the overall cash ratio sits at 4.3 %, the move signals a cautious tone among long‑term investors.
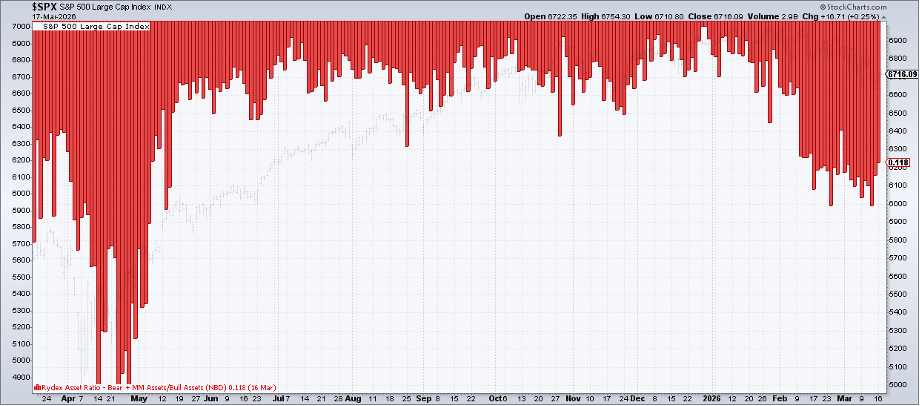
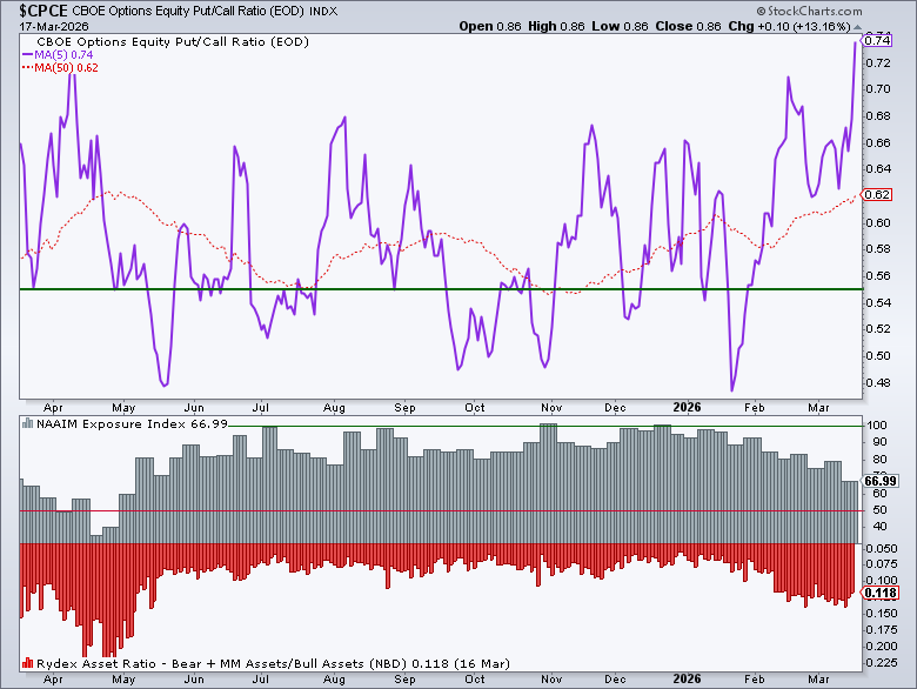
Rydex Ratio Shows Caution
The Rydex Asset Ratio compares money placed in bearish funds versus bullish ones. A higher ratio means investors prefer safety, which many traders view as a possible upside signal for stocks.
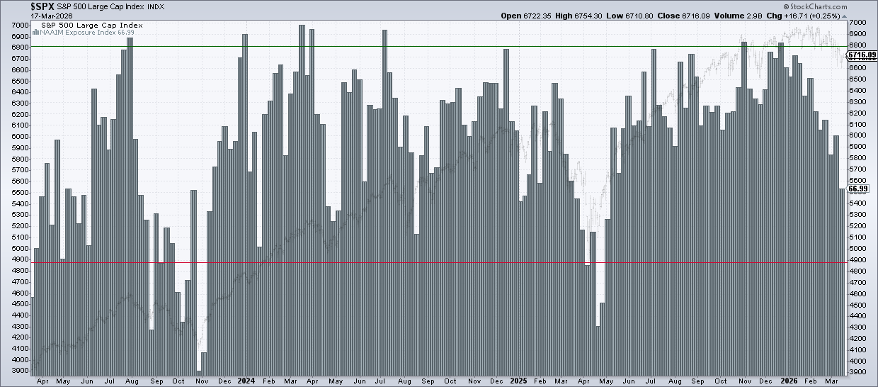
Risk Appetite Drops
The NAAIM Exposure Index slipped to 66.99 on March 12, the lowest level since April 2025. This indicates fewer aggressive bets on U.S. equities as the first quarter ends.
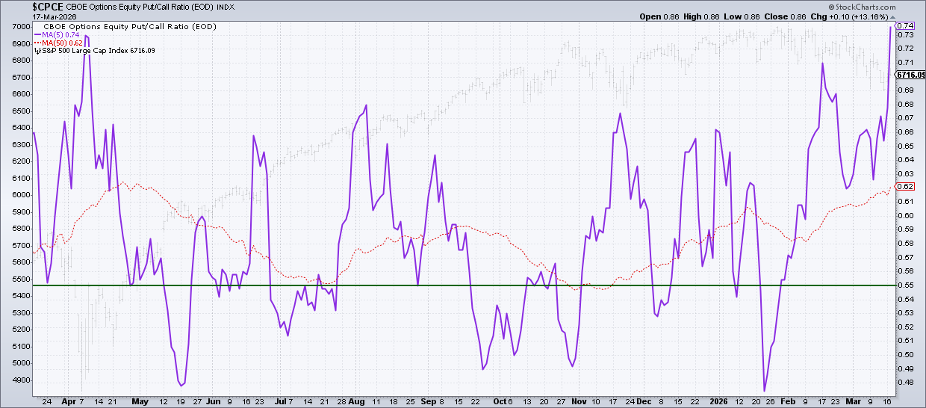
Put/Call Ratio Hits New High
The CBOE Equity Put/Call Ratio reached a year‑to‑date high on St. Patrick’s Day, showing that active traders are buying protection against future market moves.
What the Numbers Mean
These sentiment tools help traders decide if the market is simply adjusting or heading for a sharp decline. The key is to look at the whole picture, not just one number.
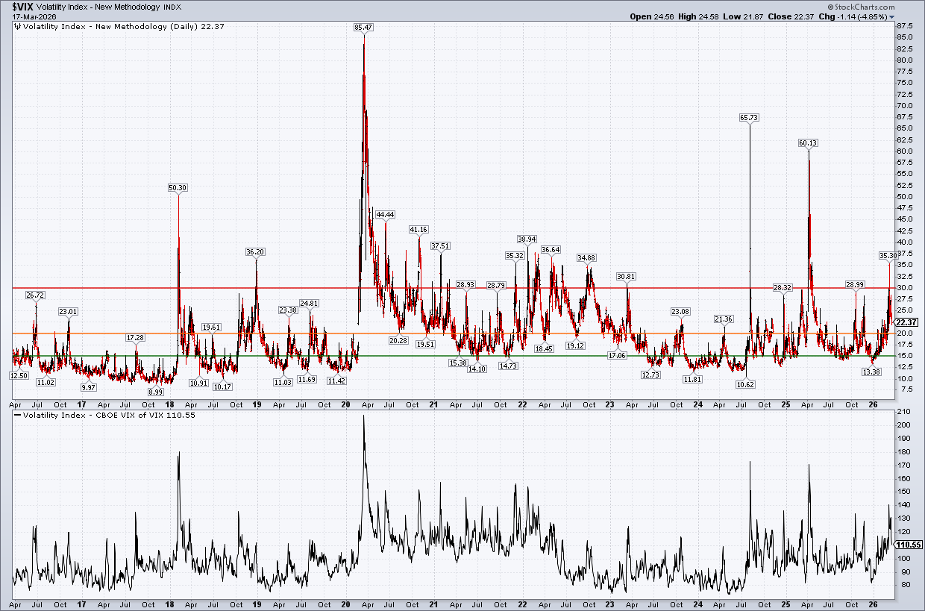
VIX and Volatility
The VIX, often called the fear gauge, spiked to 35.3 on March 9 – the highest level since April 2025. Historically, readings in the mid‑30s have coincided with lows in the S&P 500.
After the spike, the VIX fell back to the low‑20s, suggesting a possible market bottom. The related VVIX index, which tracks future volatility, also remains elevated.
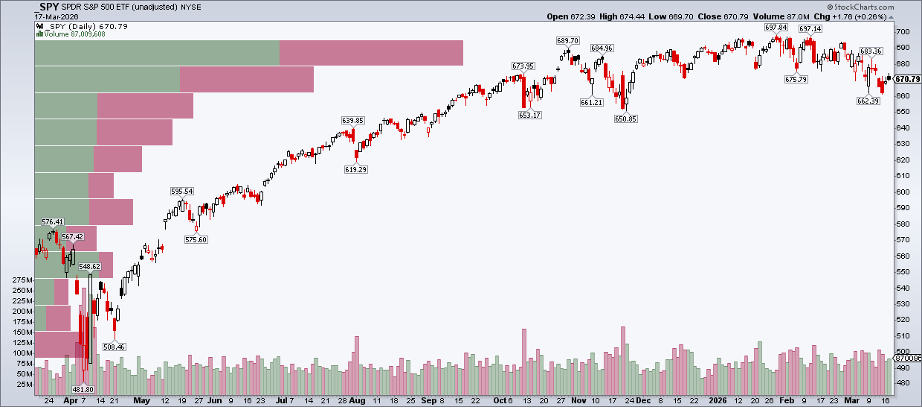
Supply Overhang Concerns
Large amounts of selling pressure are visible on the S&P 500 price chart. If the market tries to rally, it may face resistance from this built‑up supply.
Bottom Line
All signs point to a slow, downward drift rather than a sharp crash. When sentiment hits extreme levels, contrarian trades can work, but for now caution seems wise.
Keep an eye on the sentiment dashboard that bundles VIX, put/call ratios, the Rydex Ratio, and the AAII survey to stay informed.
Disclaimer: This article is for educational purposes only and does not constitute financial advice.
Source: Materials provided by https://articles.stockcharts.com.Note: Content may be edited for style and length.