

Before we start…
When the S&P 500 rises 1%, it looks strong. But sometimes only a few huge companies lift the index. The rest of the stocks may be falling.
That is why market breadth is useful. Breadth tools tell you how many stocks join the move.
What is a Breadth Indicator?
Think of a tug‑of‑war. If only a few strong players pull, the rope will soon slack when the weaker players quit. The same thing happens with stock indexes.
A breadth indicator looks at how many stocks in a market are moving up or down. It adds extra details such as:
- Number of advancing vs. declining stocks
- Stocks that break out of a price range
- Stocks hitting new highs vs. new lows
- Stocks above important moving averages
- Volume flowing into advancing or declining stocks
In short, price shows direction, while breadth shows conviction.
Why You Should Not Ignore Breadth
Many indexes give a lot of weight to a few giant stocks. Those big names can push the index higher while most other stocks stay flat or drop.
When the index climbs but most stocks do not, the rally is fragile.
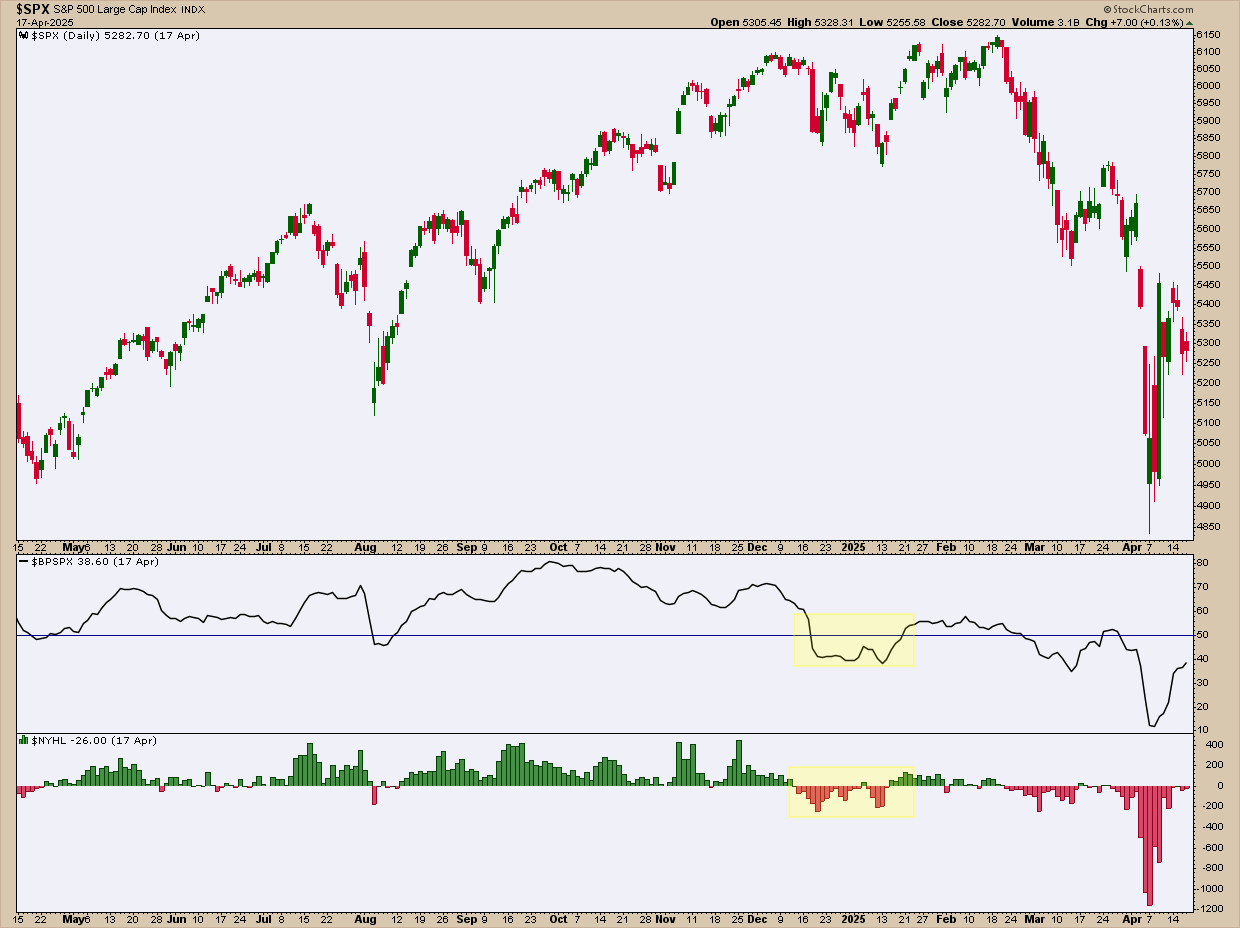
In the chart, price looks healthy, but breadth does not. The Bullish Percent Index dropped below 50, meaning fewer than half the stocks had buy signals. The Net New 52‑Week Highs went negative, showing more stocks made new lows than new highs.
Even so, $SPX kept climbing. The rally was narrow and weak, and the broader market turned down soon after.
Bottom line: breadth indicators can alert you to these hidden problems before the price shows them.
Three Market Conditions Breadth Reveals
1. Healthy Trend
Many stocks are moving up. New highs increase. Participation rises with price. This is a strong, lasting trend. Buying on a dip can work well.
2. Narrow Leadership
The index is up, but fewer stocks are helping. The rally looks good on the surface, but the underlying participation is weakening. Risk builds even if price stays high.
3. Internal Breakdown
More stocks make new lows than new highs. The market’s bullish base is cracking. These signs often appear before a big decline.
Breadth does not predict tomorrow’s price, but it clearly shows what is happening right now.
Which Breadth Indicators to Try?
Here are some common tools you can use:
- Advance‑Decline Line (AD Line)
- Advance‑Decline Percent
- Advance‑Decline Volume Line
- Advance‑Decline Volume Percent
- Arms Index (TRIN)
- Bullish Percent Index (BPI)
- High‑Low Index
- High‑Low Percent
- Net New 52‑Week Highs
- Percent Above Moving Average
- Record High Percent
Try a few on your own charts. In future posts we will explore the most useful ones in depth.
Wrapping Up
Market breadth tells you whether a move is powered by many stocks or just a handful of big names. Broad participation means healthier, longer trends. Thin participation builds hidden risk. Think of breadth as a background check on price – it reveals if strength is real or borrowed time.
Source: Materials provided by https://articles.stockcharts.com.Note: Content may be edited for style and length.