

The S&P 500 index finally pushed past 7,000. That was a big moment. After the breakout, the index stopped moving up. It is now stuck in a narrow range.
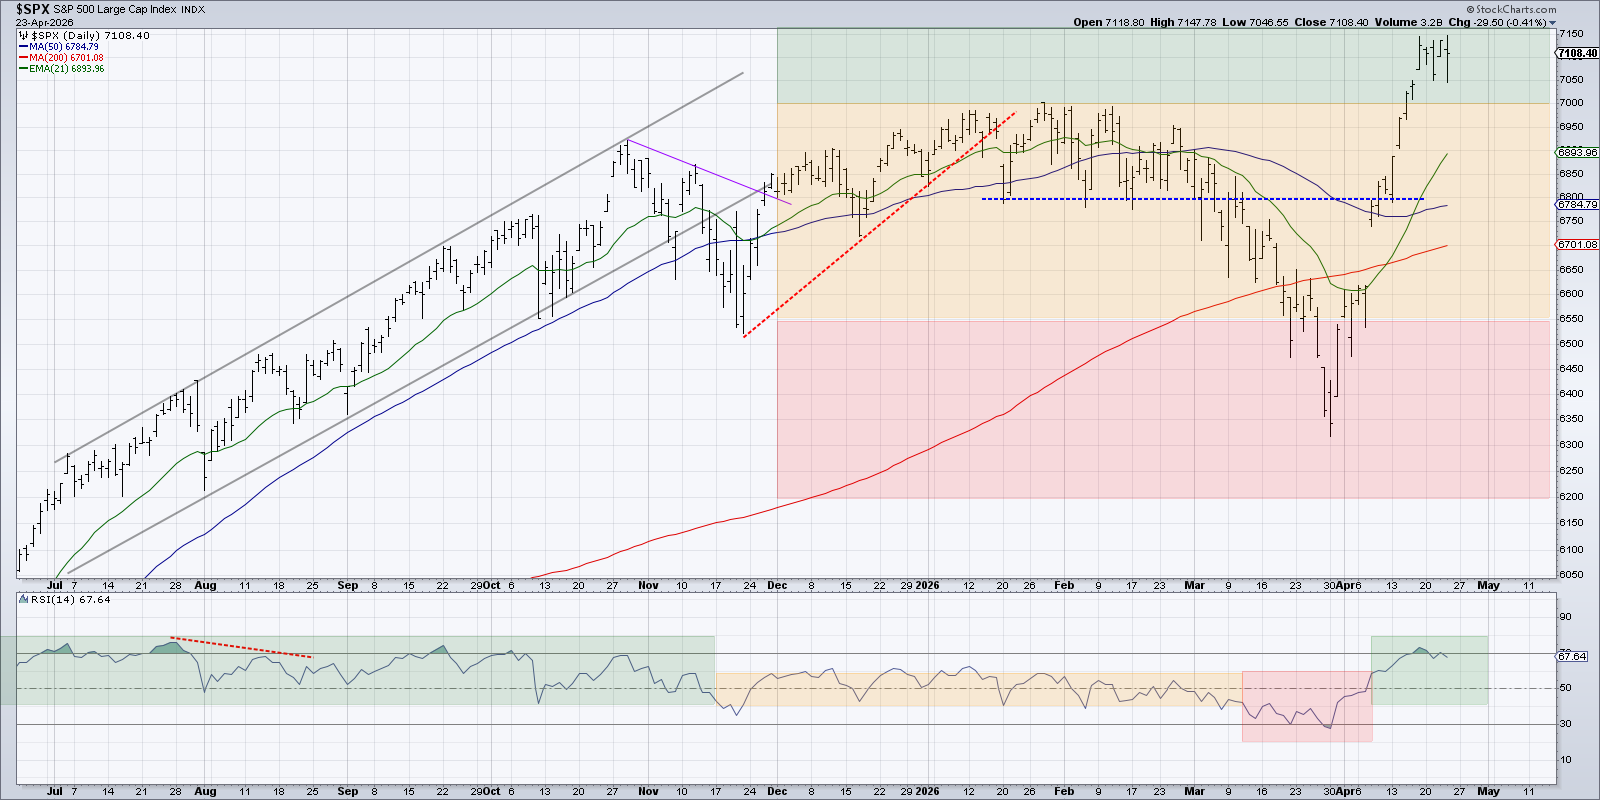
Since the jump to a close above 7,100 last Friday, the index has been flat. It has spent the whole week moving side‑to‑side. Without a clear push higher, investors are guessing what will happen next.
To help think about the future, I will use a "choose your own adventure" style analysis. I will lay out four possible paths the S&P 500 could take over the next six to eight weeks. Pick the scenario you think is most likely and explain why. Listening to all four options can also open your mind to ideas you might have missed.
We tried a similar exercise in February 2026. The bearish outcomes we outlined then proved correct in March, when the market turned sharply lower.
Now let’s look at the four scenarios for the S&P 500 from now until mid‑June 2026. The exercise has three goals:
- Think about each path, the macro factors that could cause it, and the signs that would confirm it.
- Choose the path you believe is most likely and explain your reasoning.
- Consider how each path would affect your current portfolio and how you would manage risk.
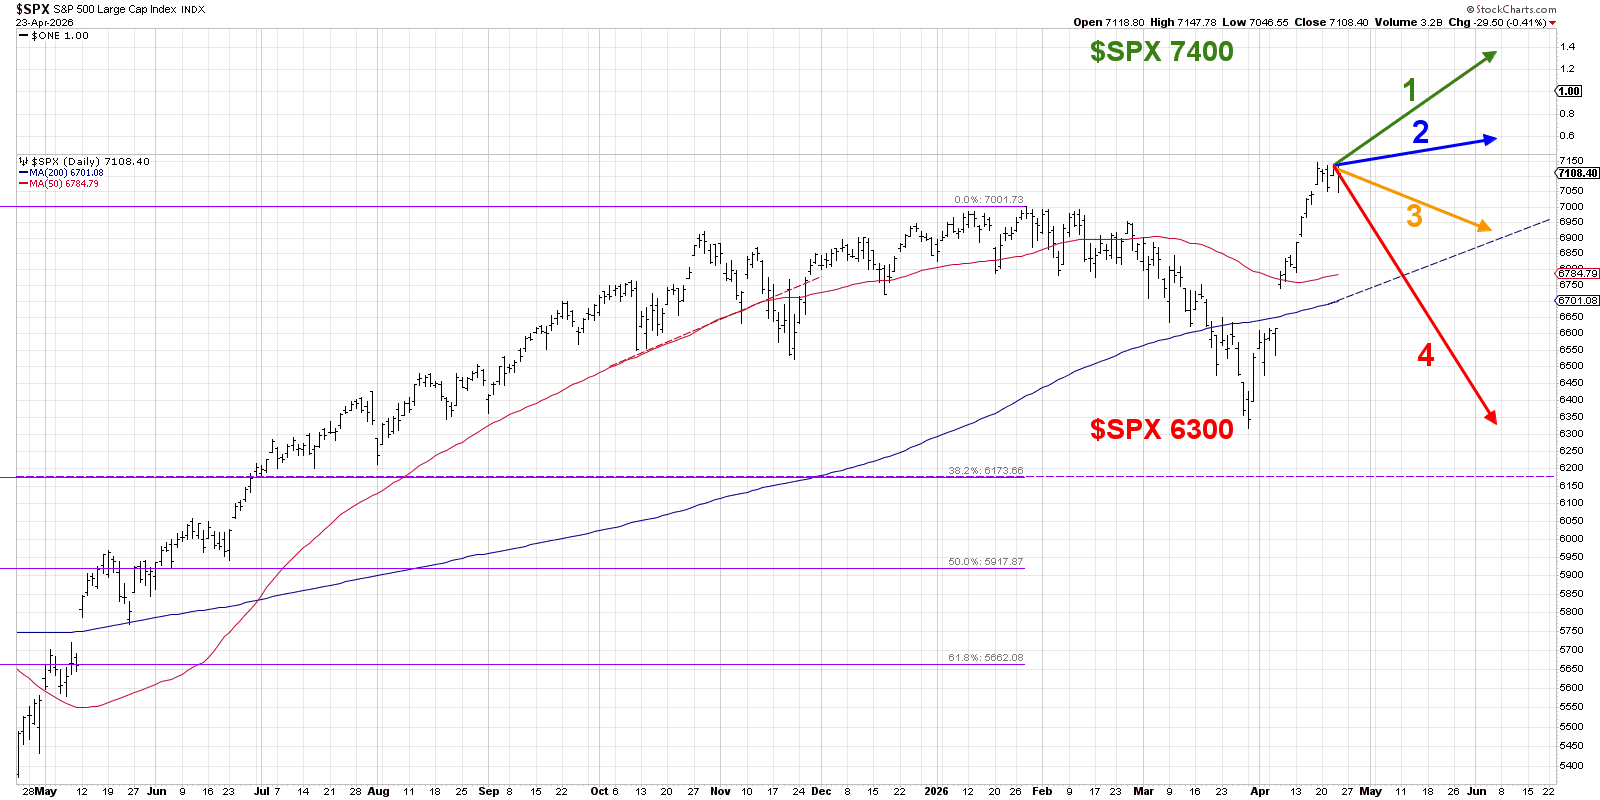
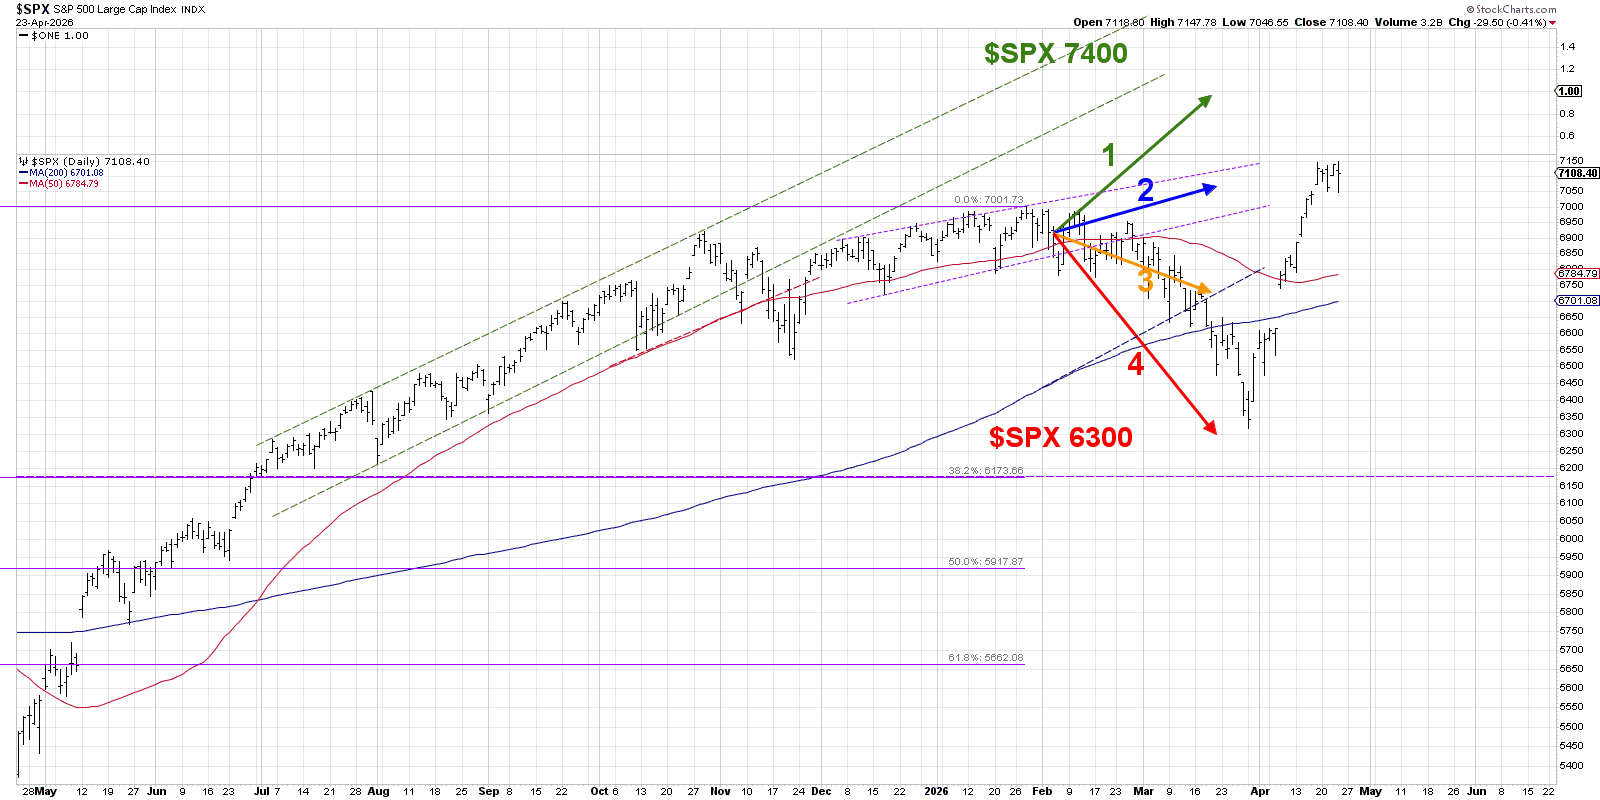
Scenario 1: Super Bullish
Imagine the market keeps climbing without a big pull‑back. The big tech stocks (the “Magnificent 7”) stay strong. Industrials and Materials also rise. In this case the S&P 500 could reach about 7,400 by mid‑June.
For this to happen, the VIX (a fear gauge) would stay mostly below 20, showing low uncertainty. The conflict in the Middle East would end quickly, letting investors focus on earnings and a hopeful economy.
Estimated probability: 5%
Scenario 2: Mildly Bullish
Suppose the United States stays involved in the Middle East, but the fighting does not get worse. The Strait of Hormuz might open with some limits, easing worries about the global economy.
Technology stocks keep doing well, but other sectors lag. The market drifts upward slowly, without a clear catalyst or big threat.
Estimated probability: 35%
Scenario 3: Mildly Bearish
In this version, one or more of three things happen: the Middle East conflict rises again, earnings forecasts are cut, or new economic data looks worse than expected.
We would see a pull‑back in the major indices. Defensive stocks (low‑volatility) would start to gain as the VIX climbs above 20. By mid‑June the market might be testing the 200‑day moving average.
Estimated probability: 45%
Scenario 4: Super Bearish
Here everything goes wrong. Tensions in the Middle East flare up, the Strait of Hormuz stays closed, and global energy supplies are disrupted. The economy feels the strain.
The S&P 500 could fall back to the March low around 6,300. Risk‑off signals would fire: credit spreads widen, the VIX spikes, defensive sectors rally, and interest rates rise. The U.S. dollar would shine as a safe‑haven.
Estimated probability: 15%
What probabilities would you assign to each path? Think about the signs you would watch for and how you might adjust your portfolio.
Disclaimer: This article is for education only. It is not financial advice. Always consider your own situation and talk to a professional before acting.
Source: Materials provided by https://articles.stockcharts.com.Note: Content may be edited for style and length.