

Utilities Break Into the Leading Five as Materials Cool Down
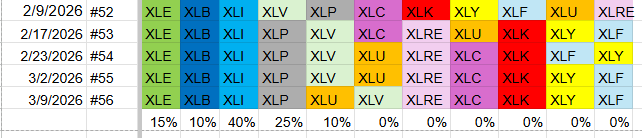
After a turbulent trading week, the hierarchy of the strongest U.S. sectors nudged a bit. Health Care slipped out, making room for Utilities, which now sit among the top performers. The current sector weightings look like this:
- 1️⃣ Energy – XLE (≈15 %)
- 2️⃣ Materials – XLB (≈10 %)
- 3️⃣ Industrials – XLI (≈40 %)
- 4️⃣ Consumer Staples – XLP (≈25 %)
- 5️⃣ Utilities – XLU (≈10 %)
Other sectors remain in the broader market but sit outside the elite group, including Real Estate, Communication Services, Technology, Consumer Discretionary, and Financials.
Weekly Relative Rotation Graph (RRG)
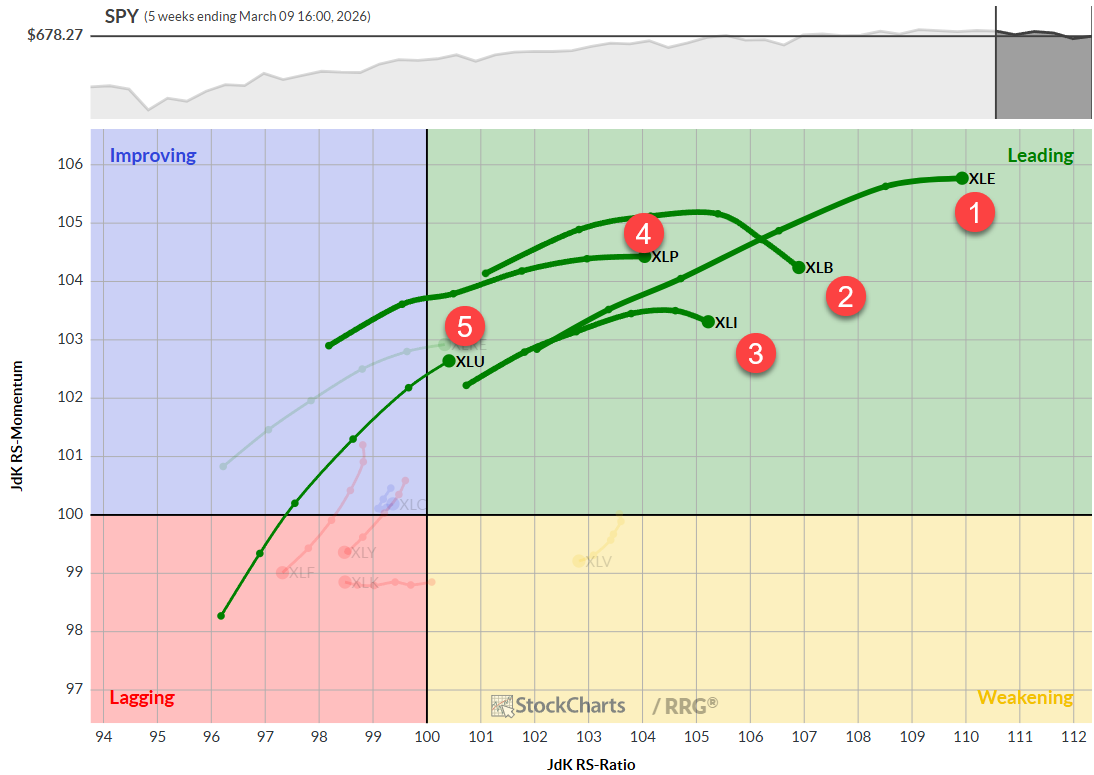
Energy continues to dominate the leading quadrant, while Materials, though still in the leader zone, shows signs of losing steam. Industrials mirror that slowdown. Utilities have entered the leader quadrant with both a positive heading and rising momentum.
Daily Relative Rotation Graph (RRG)
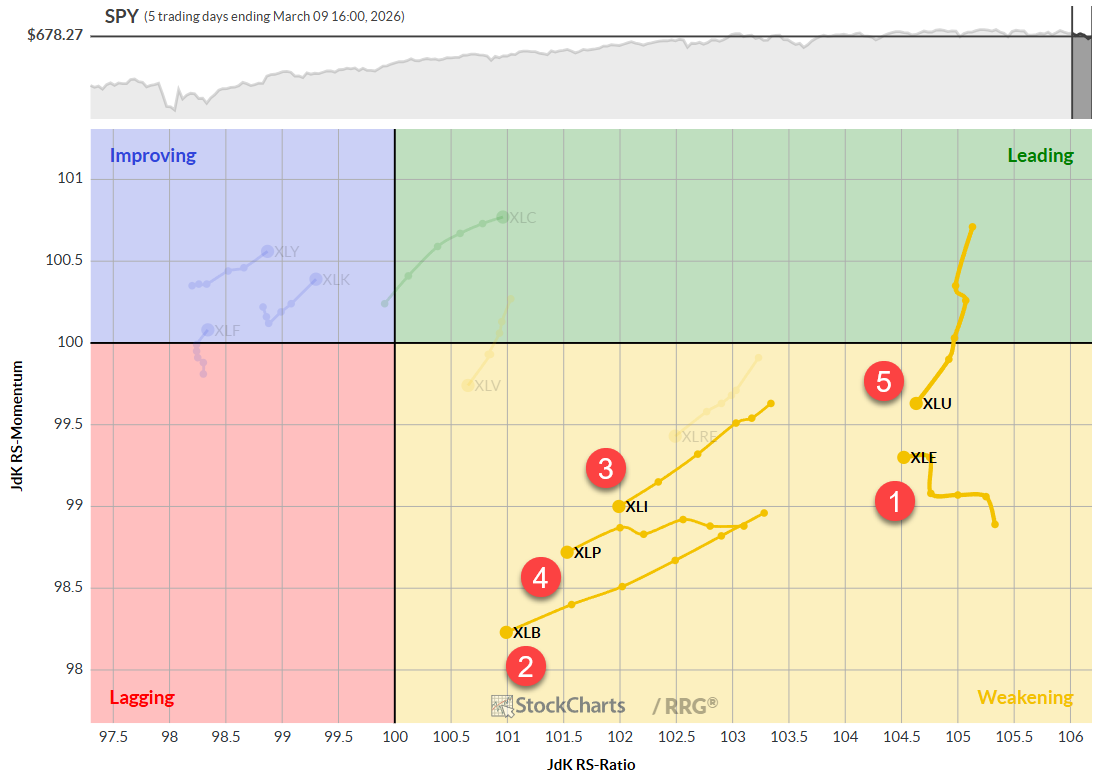
On the short‑term chart, all five leading sectors sit in the weakening quadrant, indicating a corrective phase despite their longer‑term leadership. Most still carry high RS‑ratio values, hinting at a possible bounce back. Materials is the only sector drifting toward the risk zone, with the longest tail and the lowest momentum score among the group.
Sector Spotlights
Energy
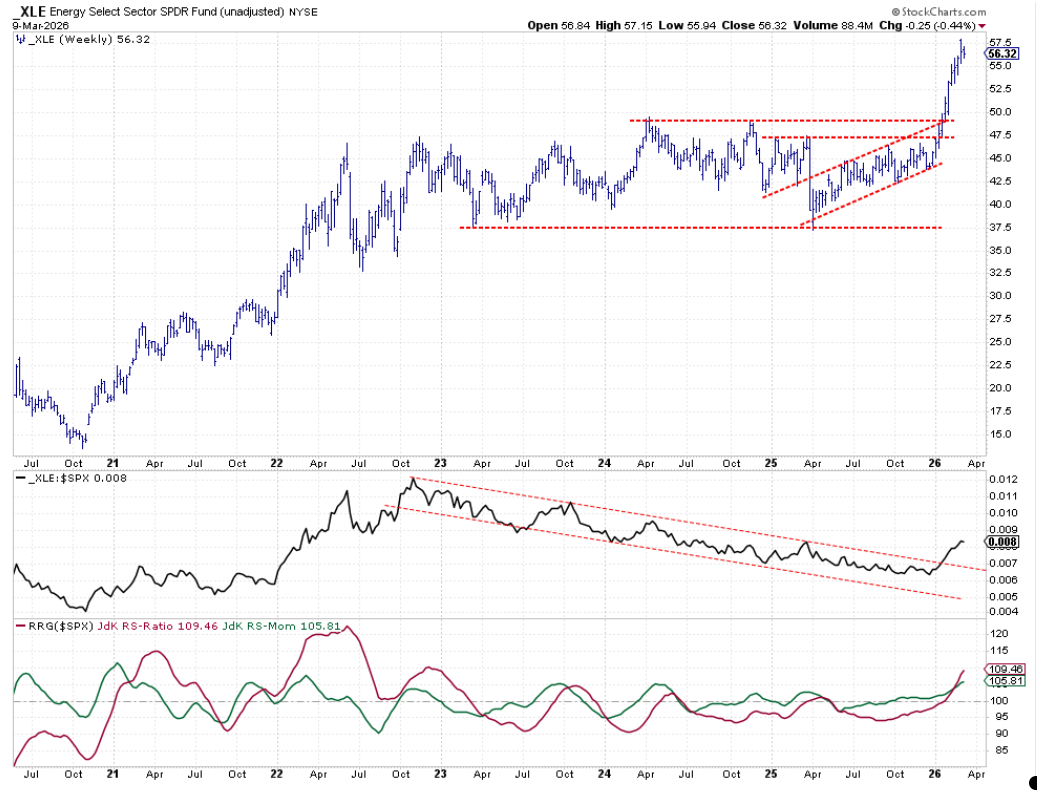
Energy has held steady around the $56 mark after its recent breakout, with relative strength still climbing. Historical RS‑ratio peaks suggest additional upside remains possible.
Materials
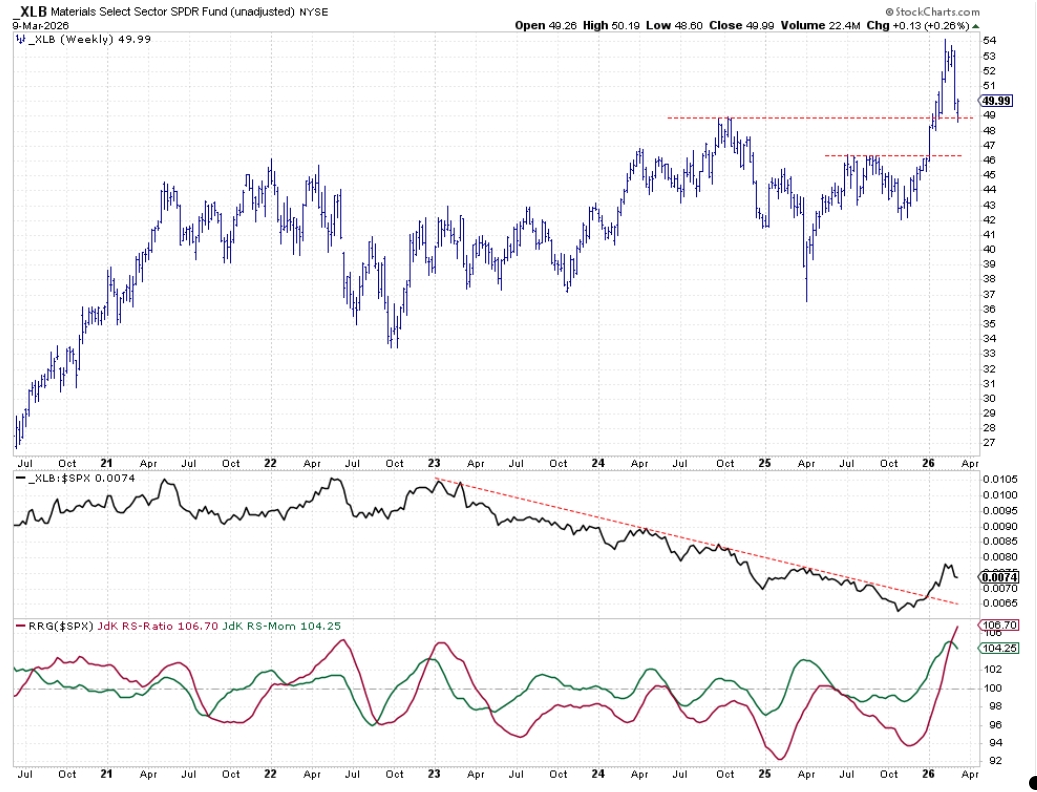
Materials suffered a sharp pullback last week but has rebounded to its prior high, now acting as support. A break below $49 could reignite the uptrend that began in 2025. While the raw relative‑strength line has escaped its earlier downtrend, momentum is beginning to wane.
Industrials
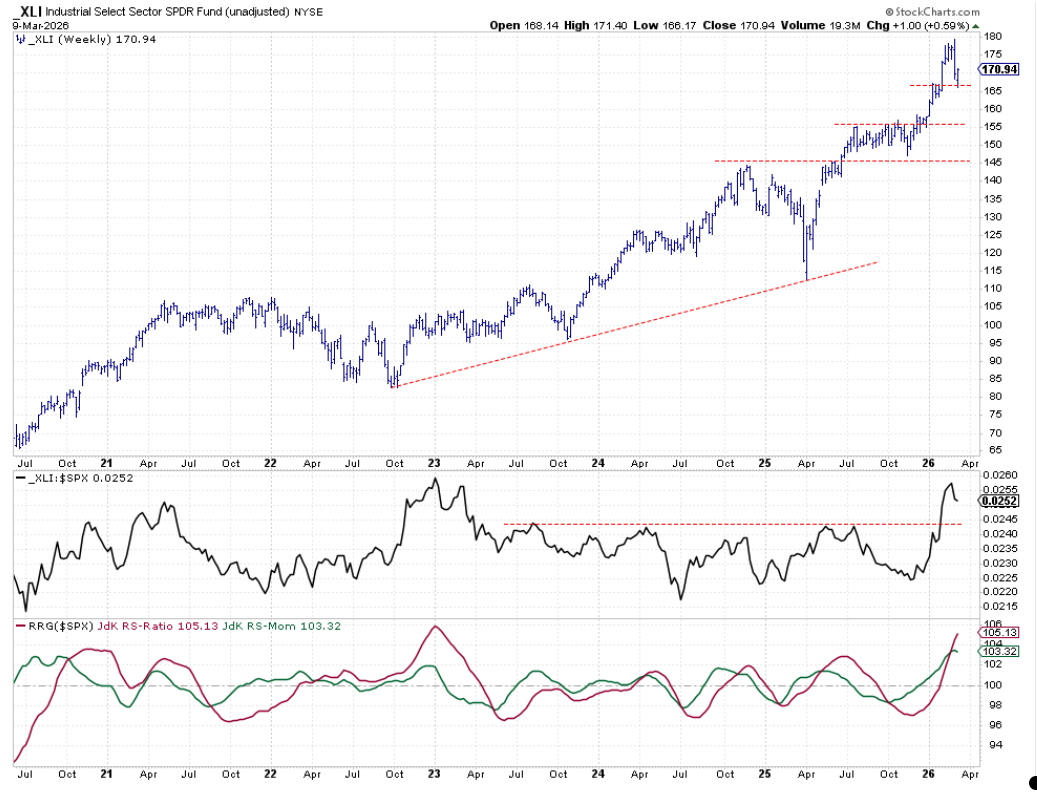
Industrials posted a modest pullback, highlighted by a reversal candle and a bounce on Monday. The low aligns with early‑2026 highs, offering intermediate support. The raw RS line remains above its 2022 peak, and the RS‑ratio sits near historic highs, though momentum is slightly slipping.
Consumer Staples
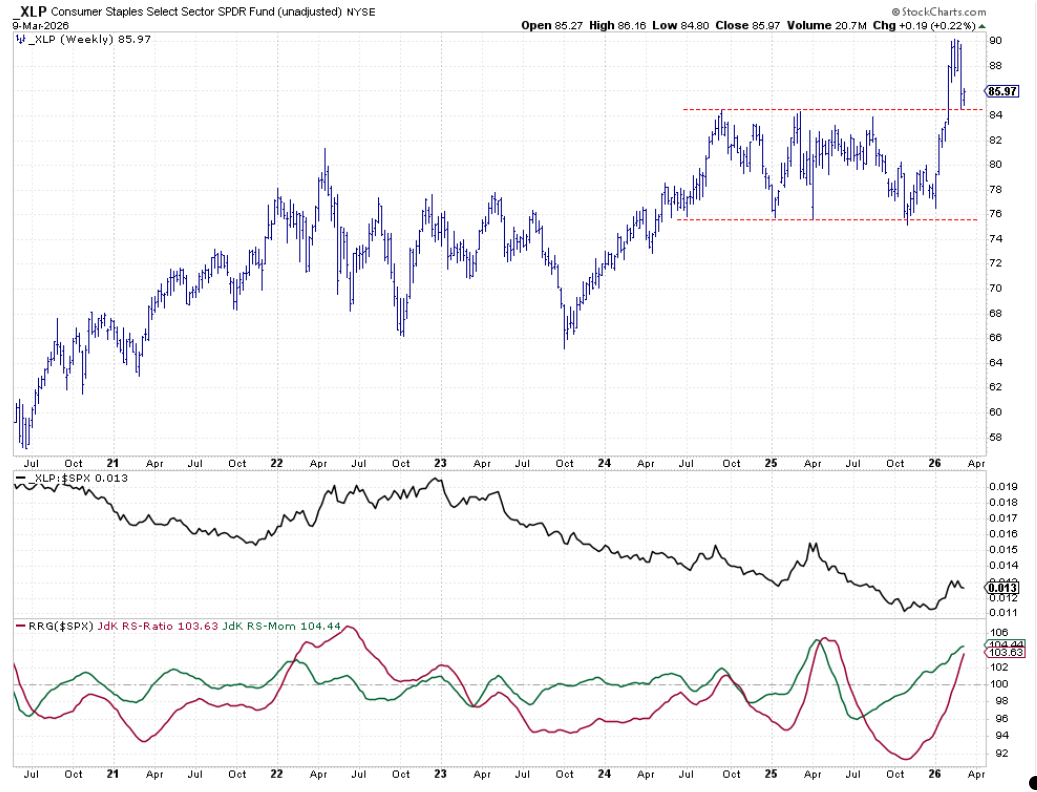
Consumer Staples plunged last week, testing the resistance just above $84, which now serves as fresh support. Holding this level would solidify the breakout and leave room for upside, as the RRG lines continue to ascend.
Utilities
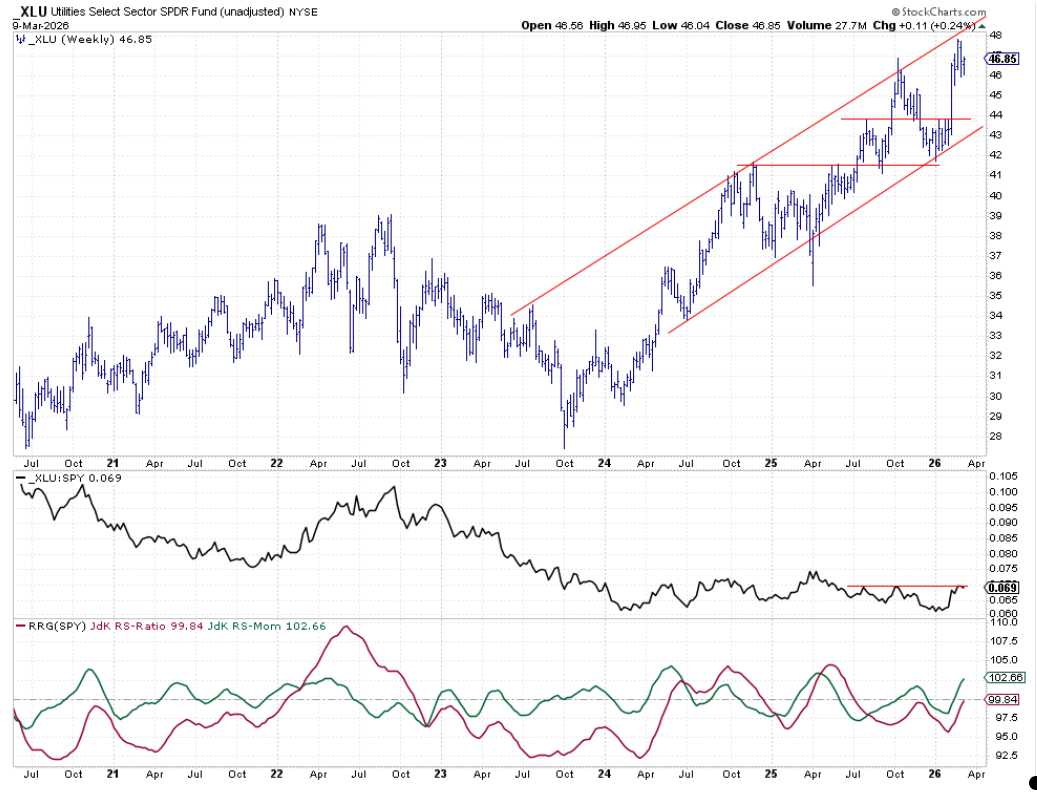
Utilities earned a spot in the top five this week, displaying positive heading and momentum on the RRG. Their rise reflects a broader search for defensive exposure amid market volatility.
Portfolio Performance Snapshot
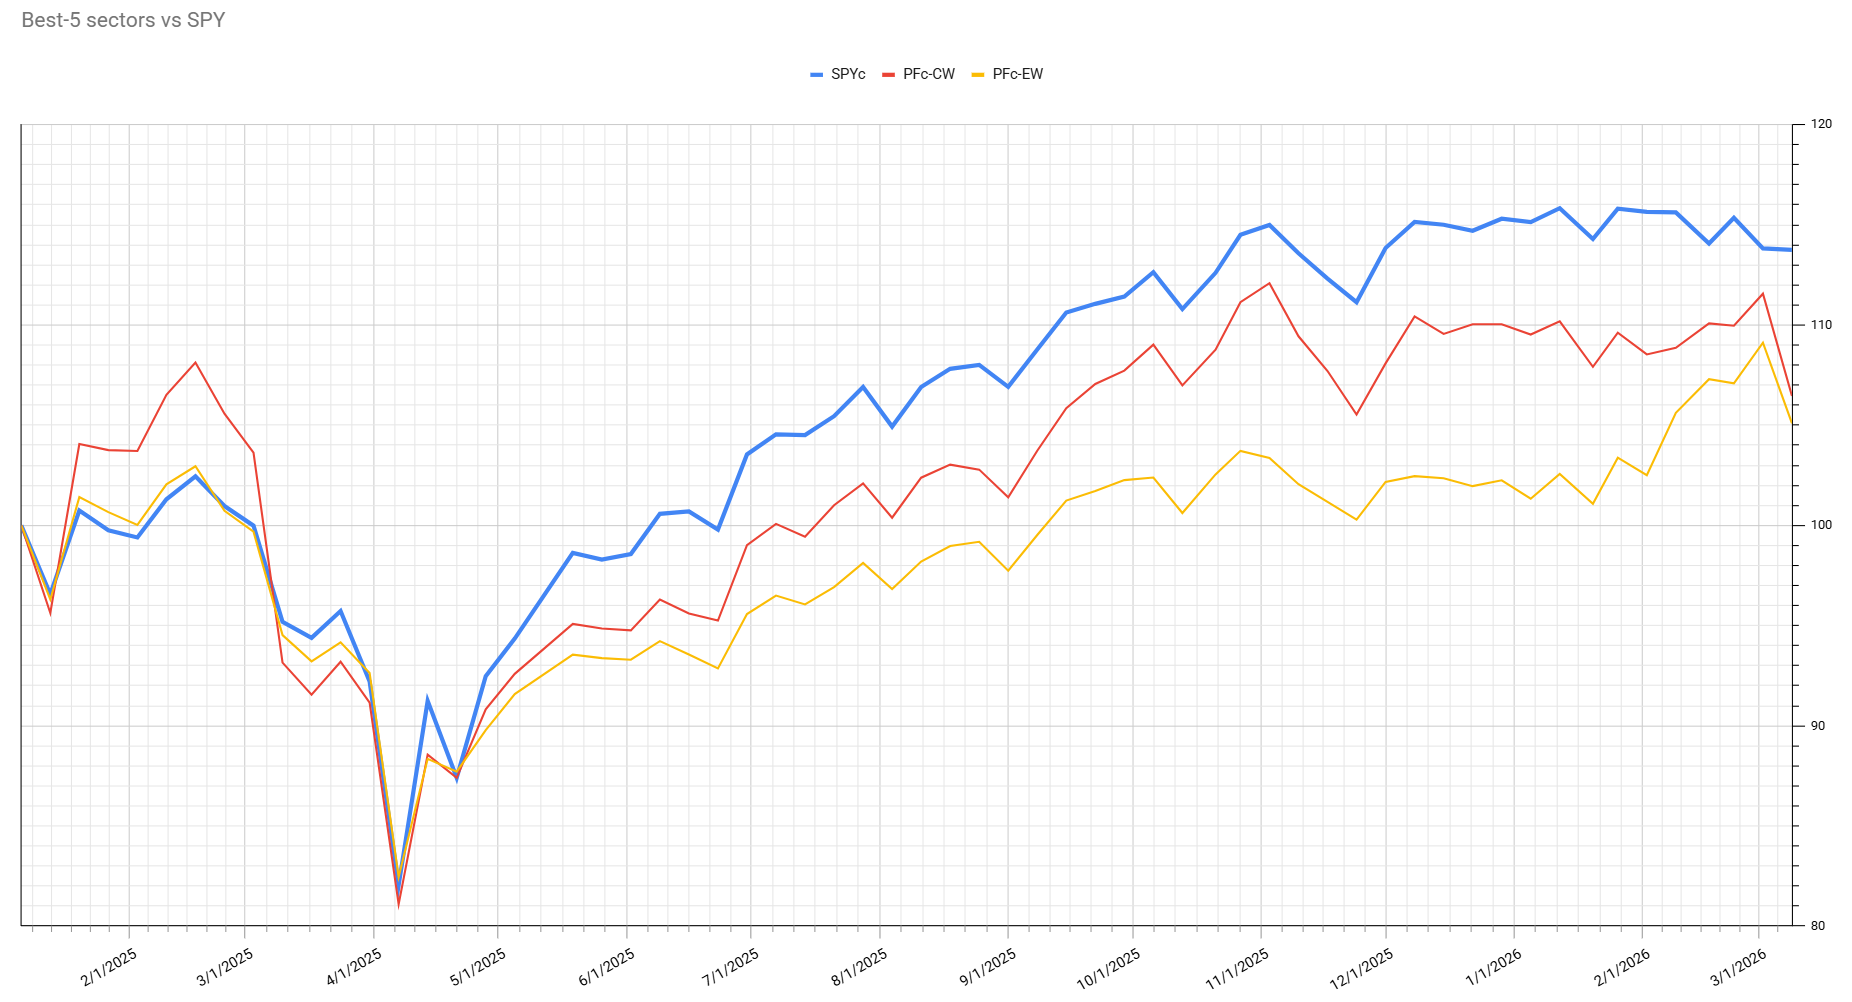
The portfolio lagged the S&P 500 last week, primarily due to losses in Industrials, Health Care and Materials. For the gap to close, those sectors need to stabilize at current support levels, form new lows, and resume their upward trajectories in both price and relative performance.
Because Health Care’s market cap exceeds Utilities, the combined market‑cap of the top five now represents roughly 20 % of the S&P 500. Consequently, the active weights of the remaining leaders have risen—Industrials now carries about 40 % and Consumer Staples around 25 %.
Source: Materials provided by https://articles.stockcharts.com.Note: Content may be edited for style and length.