

Earlier this year, energy‑heavy sectors such as Energy, Materials, and Industrials kicked off 2026 with clear momentum, while the technology space lagged behind. Recent price action in the Technology Select Sector SPDR Fund (XLK) suggests the sector may be turning the corner and reclaiming some of its lost leadership.
Current Trend Overview
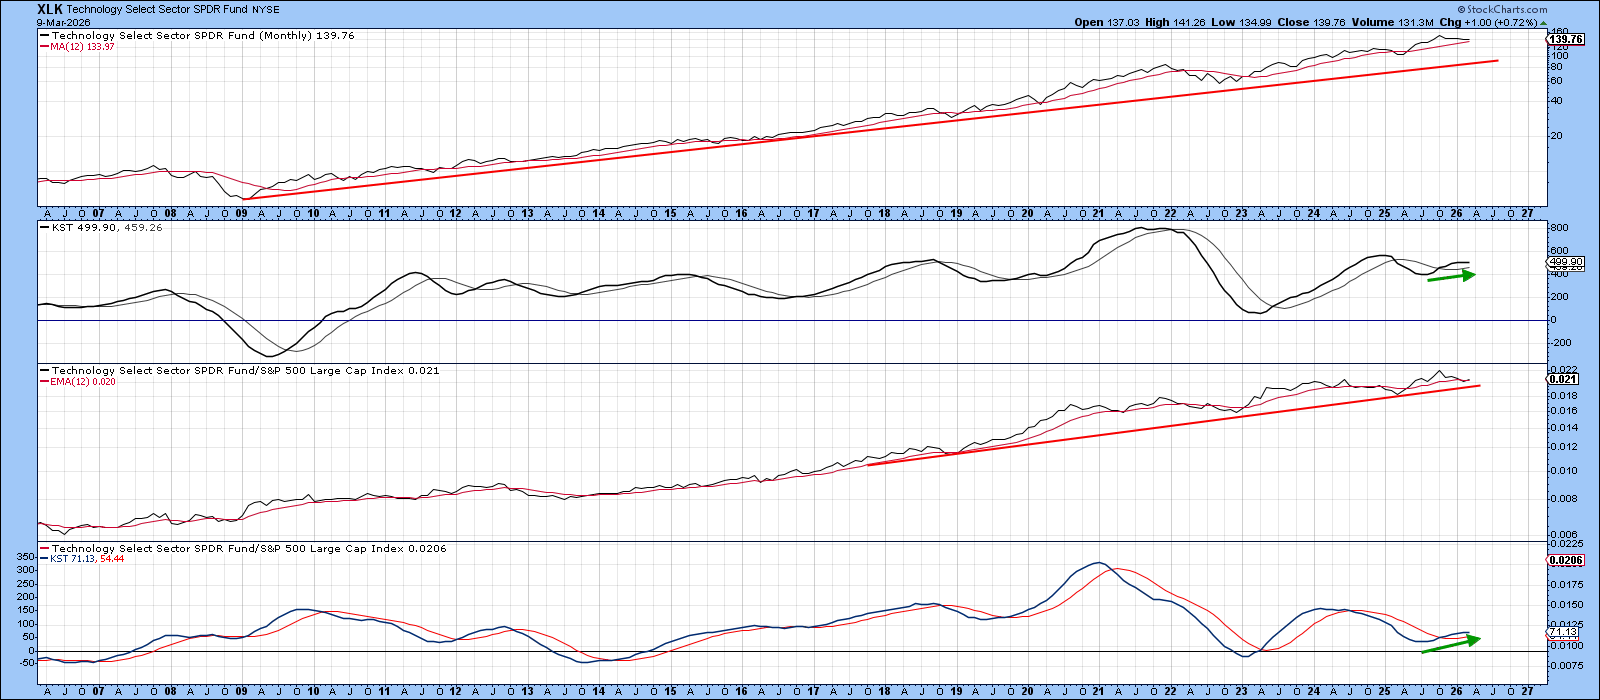
XLK is trading above its 12‑month moving average and remains above a long‑term upward trendline, indicating a primary uptrend. The longer‑term Know Sure Thing (KST) oscillator is also in positive territory, reinforcing the bullish bias.
Potential Symmetrical Triangle Formation
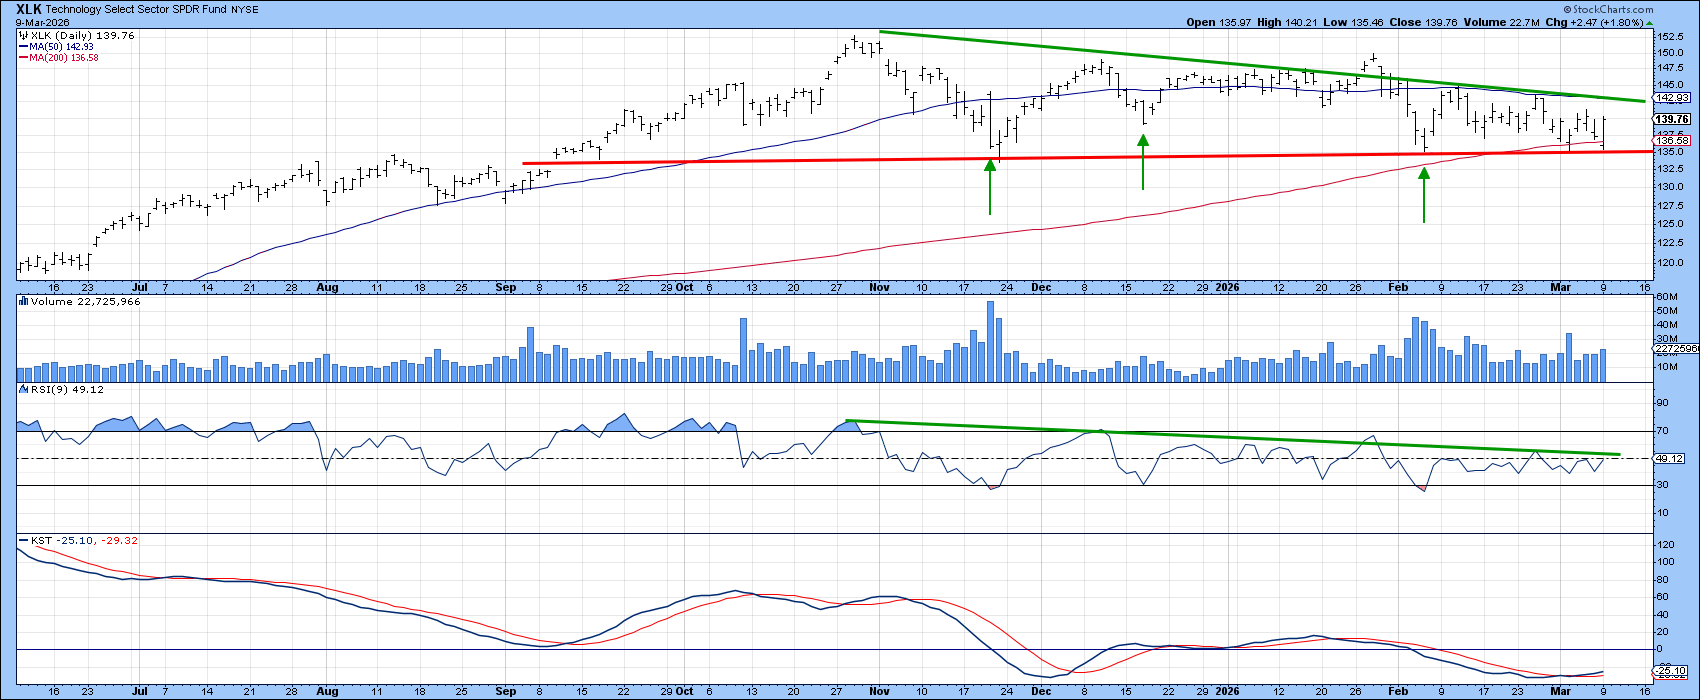
The price recently found support near the 2025‑2026 red trendline and the 200‑day moving average, then bounced off what appears to be the lower boundary of a symmetrical triangle. A bullish daily KST and a quick RSI rebound from oversold levels add to the upside narrative. A break above the green resistance line—aligned with the 50‑day moving average—could signal a decisive move higher.
Relative Strength vs. the S&P 500
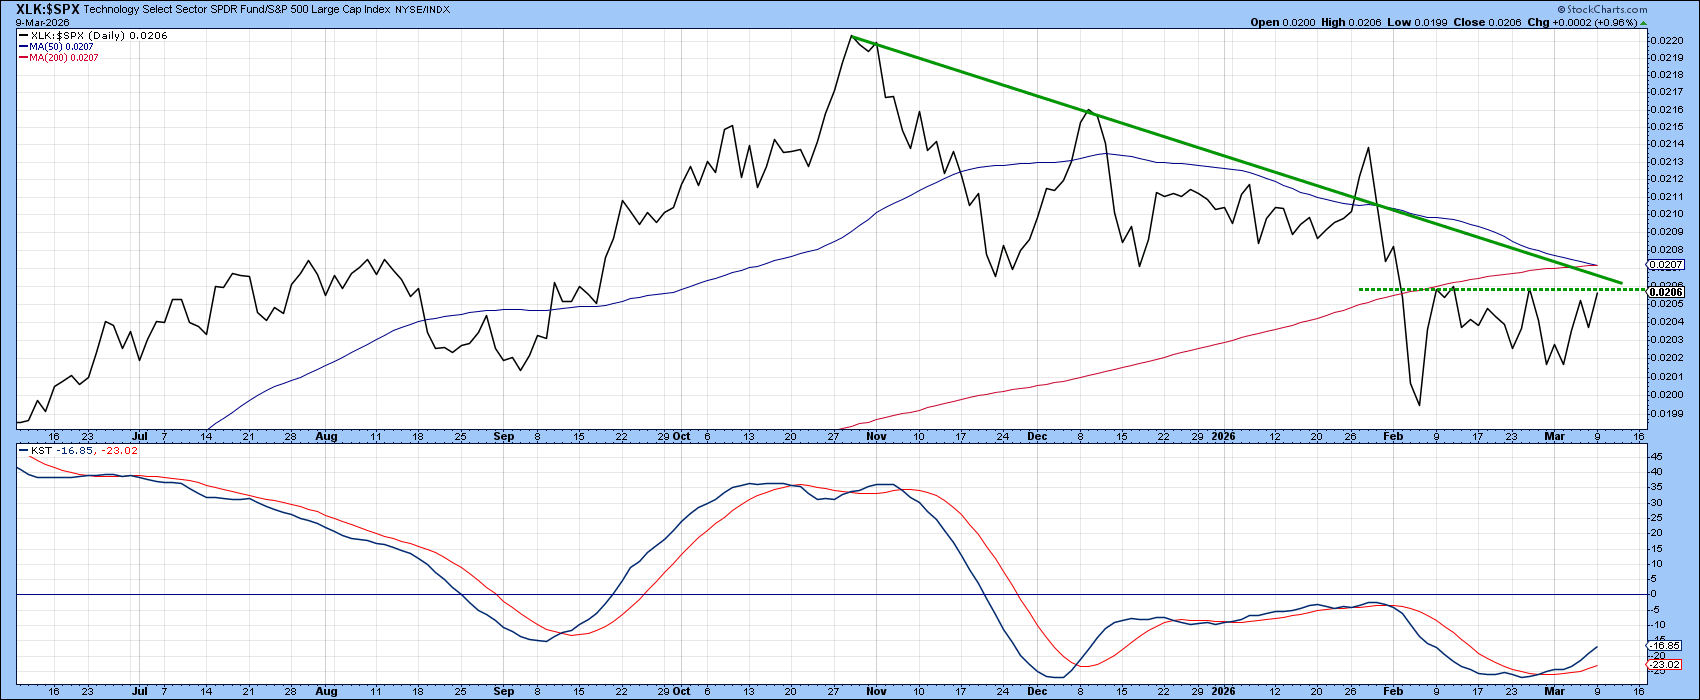
When comparing XLK’s relative strength line to its daily KST, the KST has turned bullish, suggesting that XLK could soon outpace the broader market. A breakout above the converging trendlines and the overlapping 50‑ and 200‑day moving averages would strengthen that case.
Internal Technology Indicators
StockCharts’ proprietary indicators paint a picture of an oversold yet ready‑to‑rally sector. The “Silver Cross” metric—counting stocks where the 20‑day EMA crosses above the 50‑day EMA—has been edging upward, hinting that more tech stocks are gaining momentum.
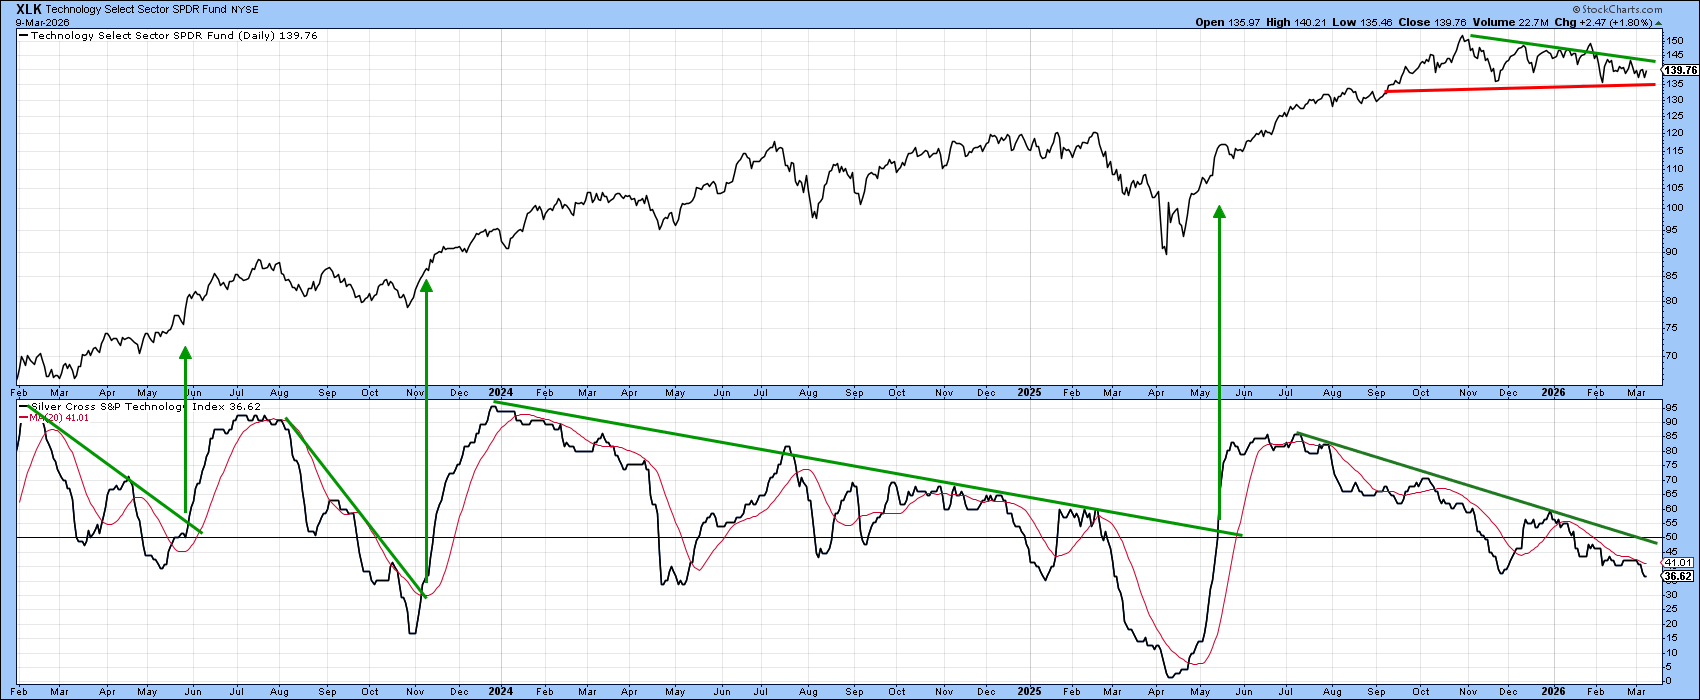
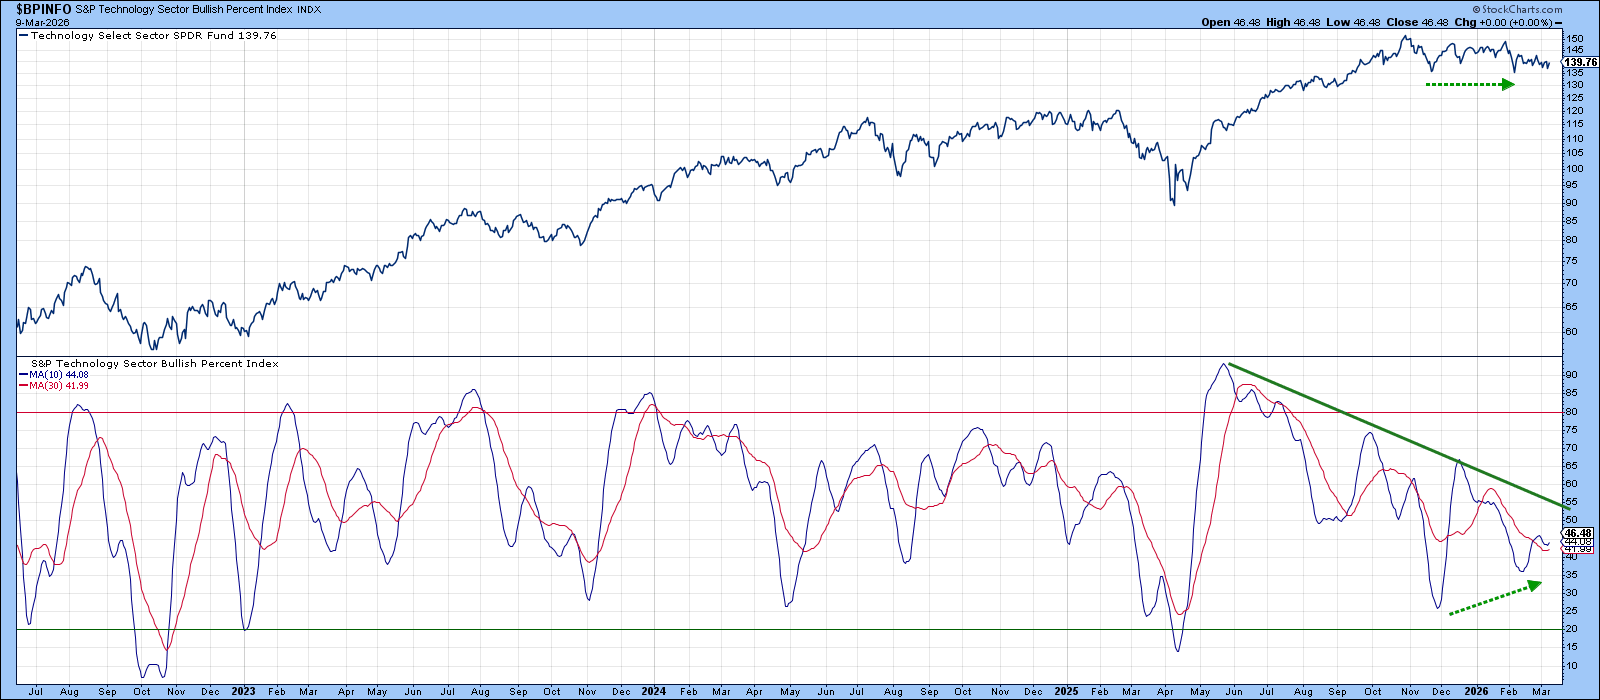
In February, XLK revisited the price level it hit in December, but the bullish‑percent reading improved, meaning fewer components were dragging the sector down. This internal strength is a subtle yet encouraging sign.
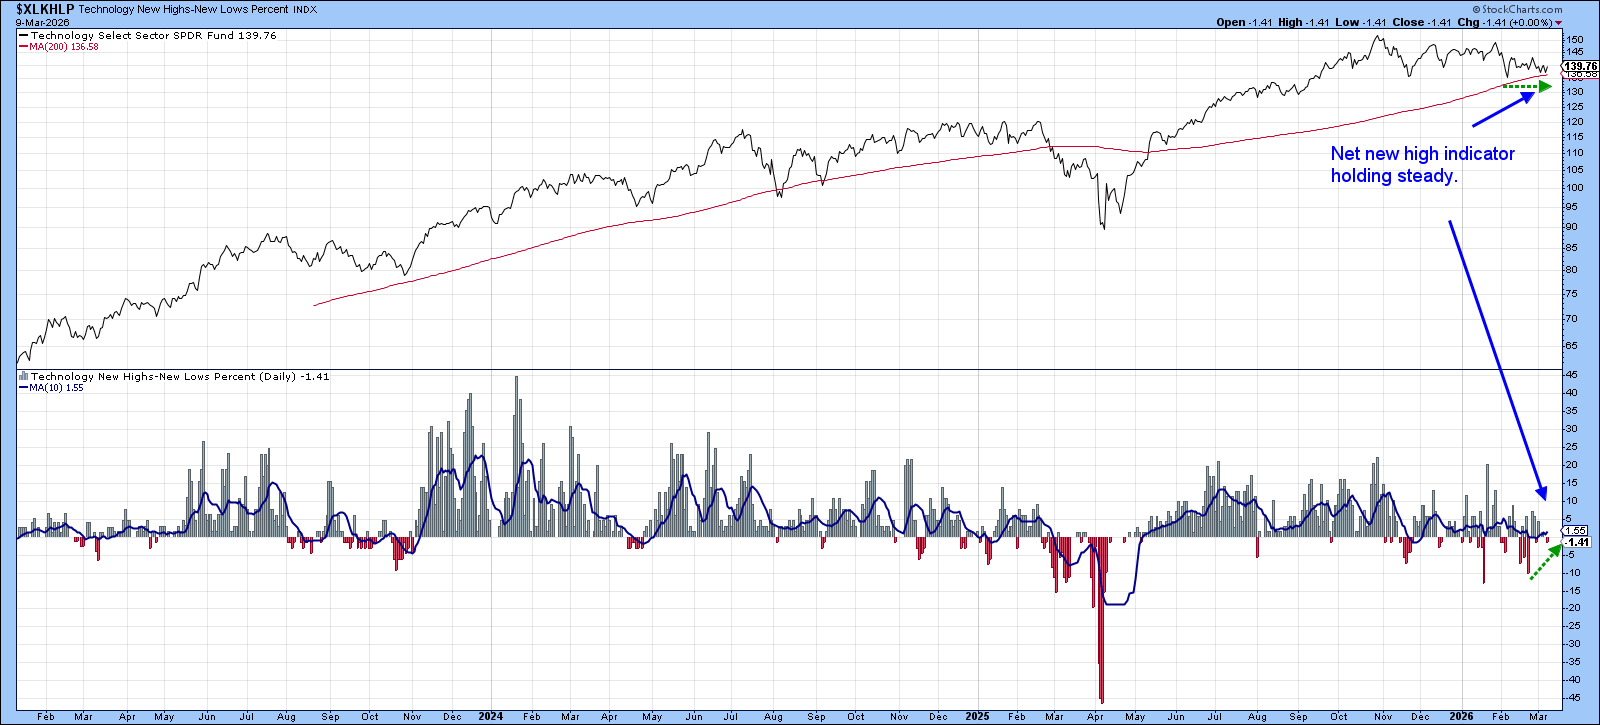
Another supportive metric, the net‑new‑high indicator, stalled its decline during the early March sell‑off, indicating that technology stocks chose not to surrender further ground.
Bottom Line
Technology stocks are not out of the woods yet, but a handful of positive technical triggers could shift sentiment dramatically. If XLK manages to break the key resistance zones and internal indicators stay firm, the sector may well regain a leadership position in the broader market.
Source: Materials provided by https://articles.stockcharts.com.Note: Content may be edited for style and length.