

Since late February the S&P 500 has slipped under the 6,800 level and even fell past a key line at 6,550. All the major indexes are now below their 200‑day moving averages, which usually means a clear downtrend.
We will look at why this drop feels different, how to set a new downside target, and what a short‑term bounce might look like.
Below the 200‑Day Moving Average
The index is under its 200‑day line for the first time since May 2025. Momentum has turned from a flat market to a distribution phase. In simple terms, sellers are now in control.
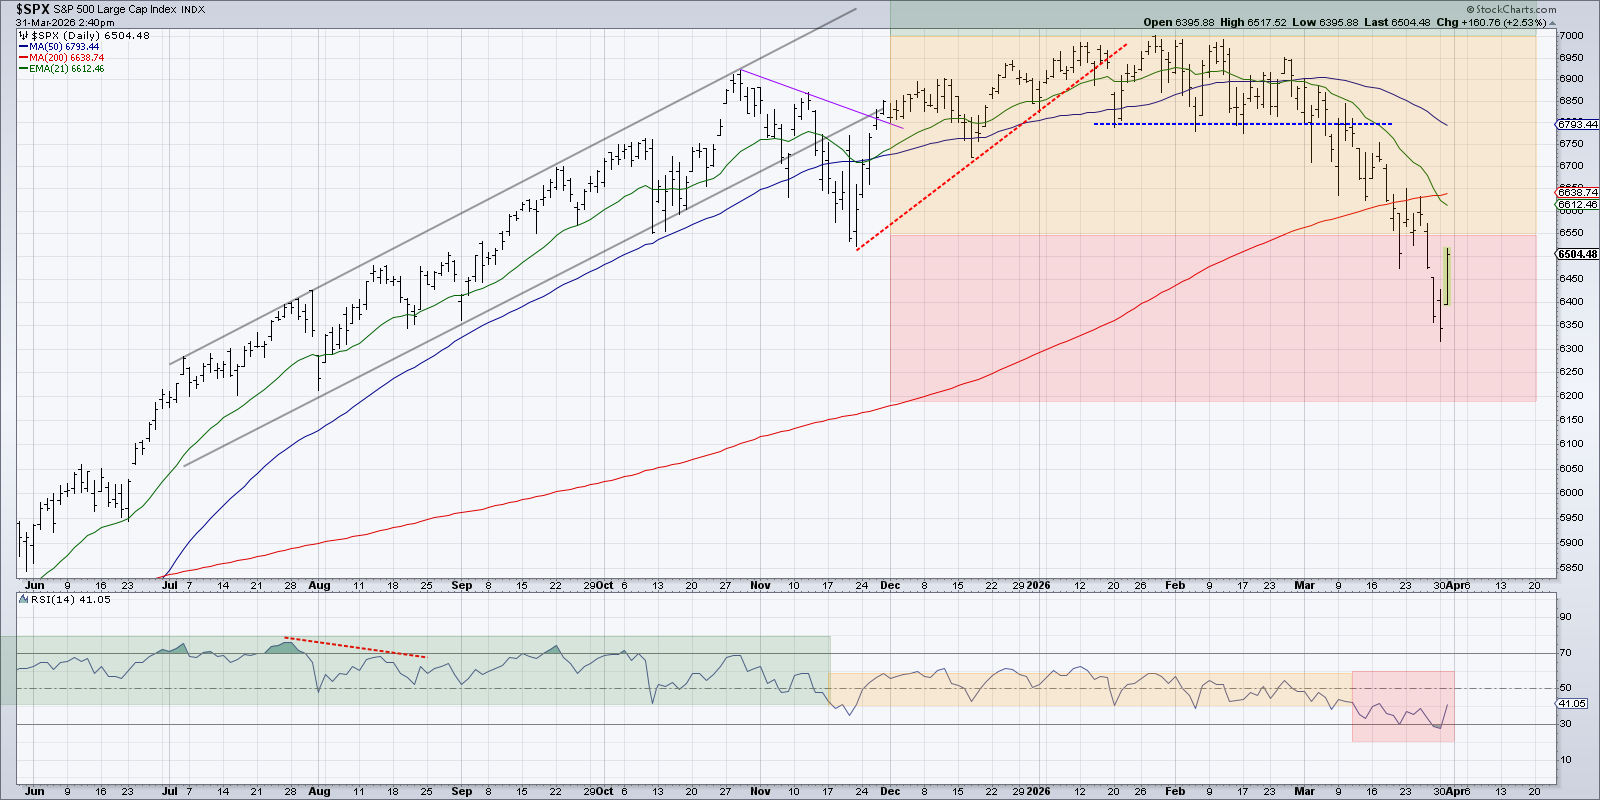
Our “traffic‑light” view treats 7,000 as a strong resistance point and 6,550 as a key support area. With the price under 6,550 and the 200‑day line far behind, the market shows a red‑light downtrend unless the average is recaptured.
The RSI has stayed in a neutral zone (40‑60) since November 2025. This suggests buyers and sellers were balanced, but the recent price drop shows sellers are winning now.
Setting a New Downside Target
Because the index is firmly below the 200‑day line, we need a fresh target. Looking back to the start of 2025 helps put today’s move in context.
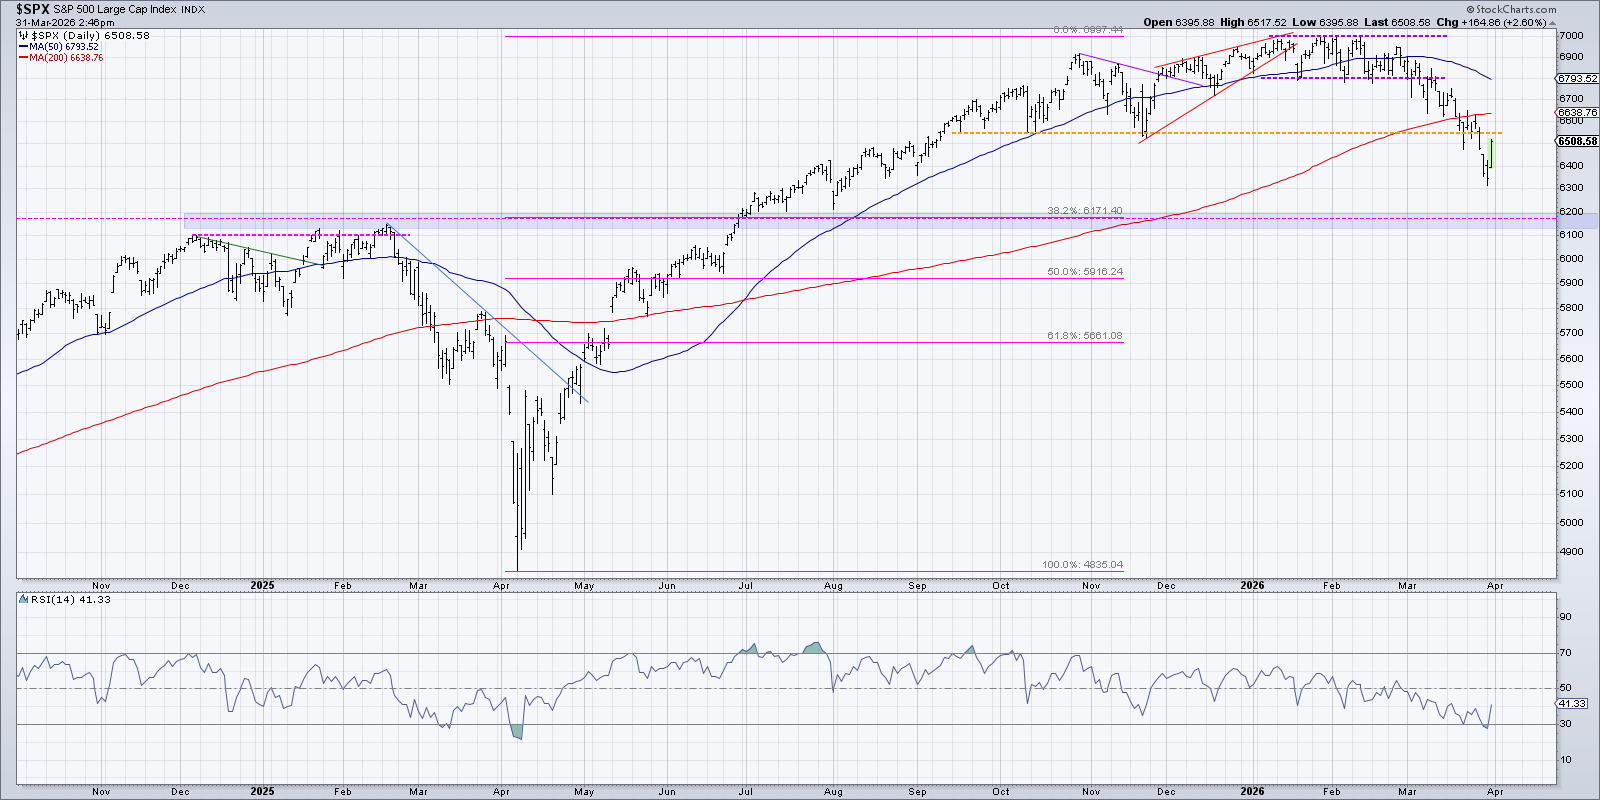
Using Fibonacci from the low in April 2025 (around 4,850) up to the January 2026 high (7,000), the 38.2% retracement lands near 6,170. This line matches the early‑2025 peak of about 6,150.
If the index falls to 6,150, that would be roughly a 12% drop from its all‑time high. Such a pullback is common even in strong bull markets, so a move toward this level would not be unusual.
Snapback Rallies: Quick, Sharp, and Tempting
During bear markets, eager buyers often jump into short‑term rallies hoping for a full recovery. A good example happened in early 2025.
After peaking near 6,150 in February 2025, the index dropped to about 5,500 before a quick bounce took it back to the 200‑day line. That line then acted as resistance, and the lack of new buyers let the downtrend continue to a low in April 2025.
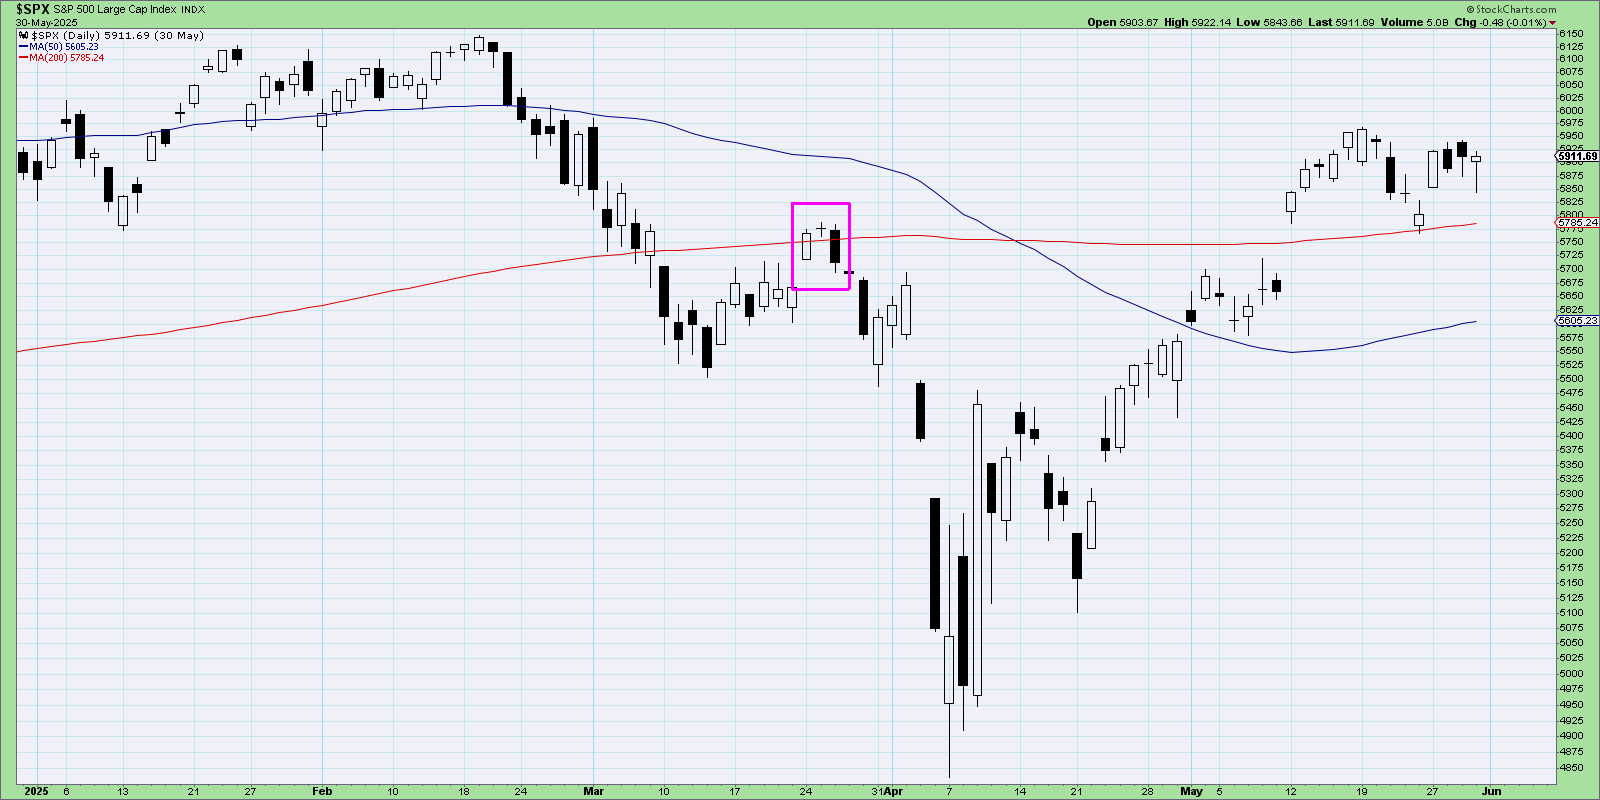
The March 2025 rally formed an “evening doji star” pattern: a strong up day, a doji (open and close almost the same), and a big down day. This three‑candle setup signaled that buyers were tiring out.
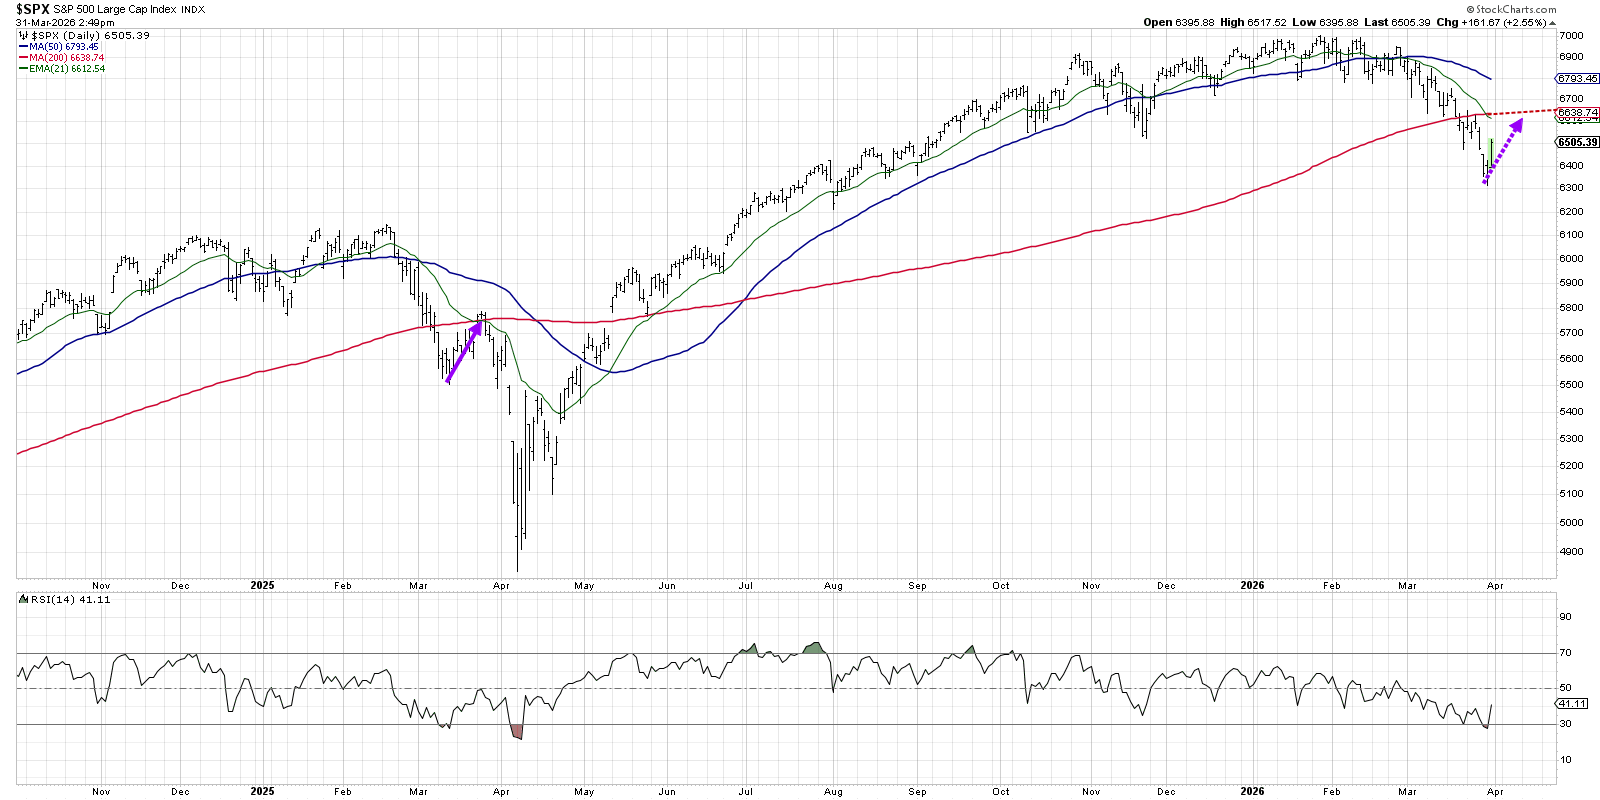
If we see a similar short‑term bounce toward the 200‑day line, we should watch for signs of buyer fatigue. While single candle patterns do not dictate long‑term trends, they can confirm what the bigger picture is showing.
Source: Materials provided by https://articles.stockcharts.com.Note: Content may be edited for style and length.