
Defensive Sectors Stay Strong When Markets Wobble
The S&P 500 slipped about 2% last week. Even with the dip, the rankings of the main sectors did not change. Investors are still leaning toward the safer, defensive parts of the market.
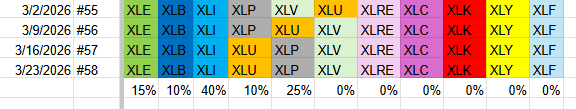
- Energy – XLE (15%)
- Materials – XLB (10%)
- Industrials – XLI (40%)
- Utilities – XLU (10%)
- Consumer Staples – XLP (25%)
- Health Care – XLV
- Real Estate – XLRE
- Communication Services – XLC
- Technology – XLK
- Consumer Discretionary – XLY
- Financials – XLF
Weekly Relative Rotation Graph
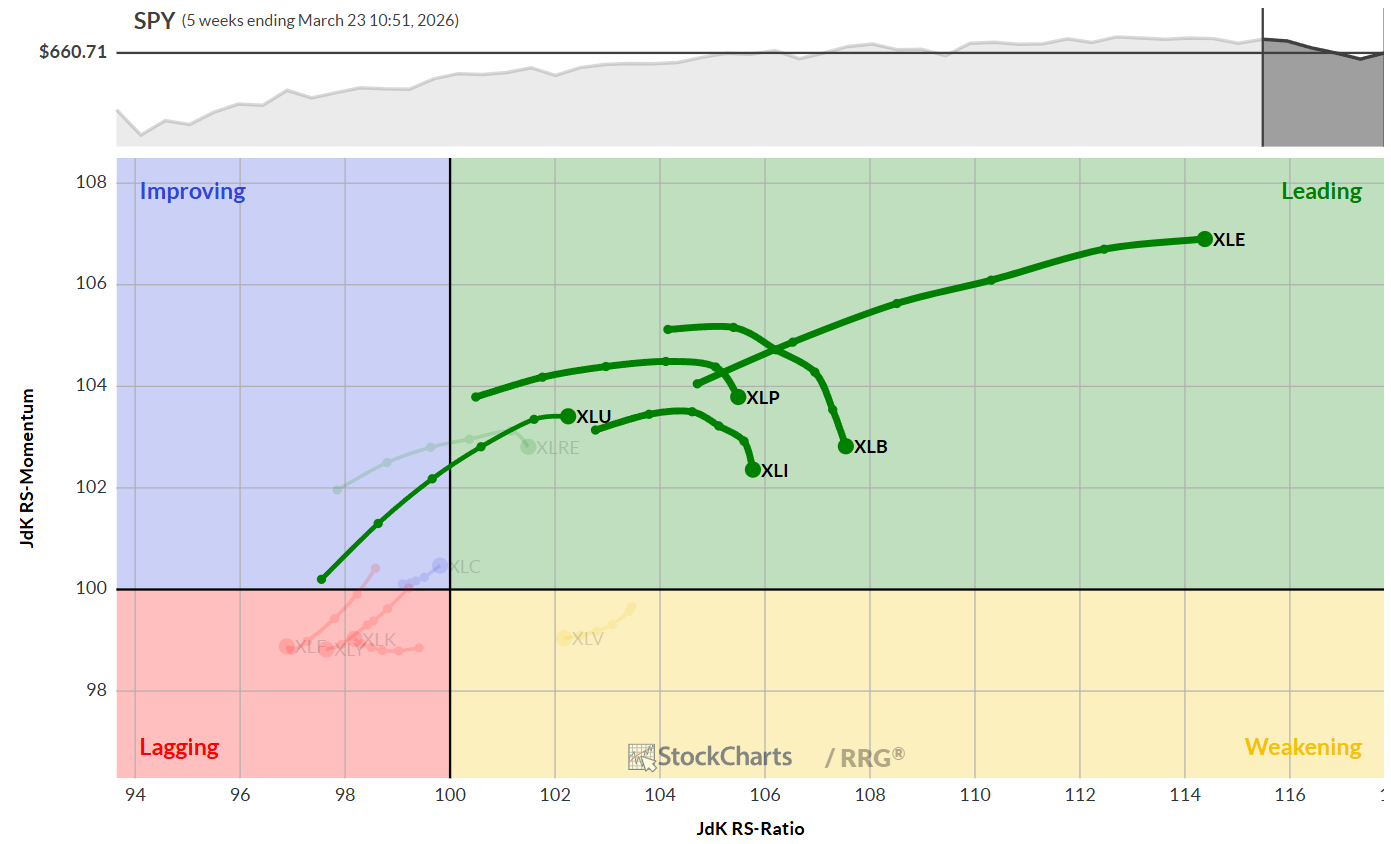
All five leading sectors stay in the top‑right quadrant. Energy is the strongest, moving strongly upward. Utilities also point upward but with the weakest strength among the leaders.
Industrials, Consumer Staples and Materials are still leaders, though they have lost a little momentum.
Daily Relative Rotation Graph
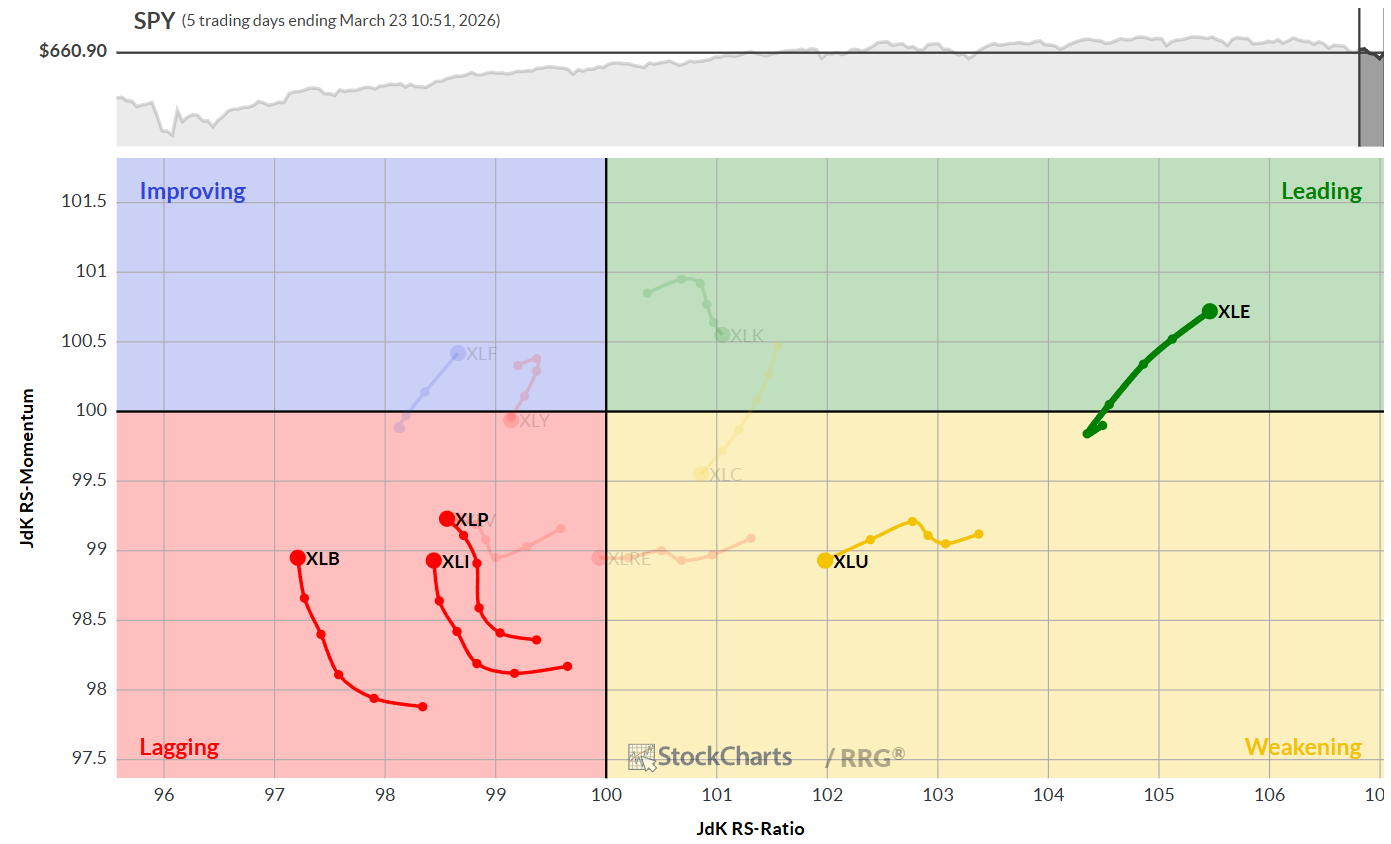
Energy keeps its lead on the daily chart. Utilities sit on the right side, showing positive strength but slipping a bit in momentum.
Materials, Industrials and Consumer Staples sit in the lagging area but are starting to pick up speed. If they turn upward, they could help the weekly picture.
Technology, Consumer Discretionary and Financials remain deep in the lagging zone, showing weak strength and momentum.
Sector Snapshots
Energy
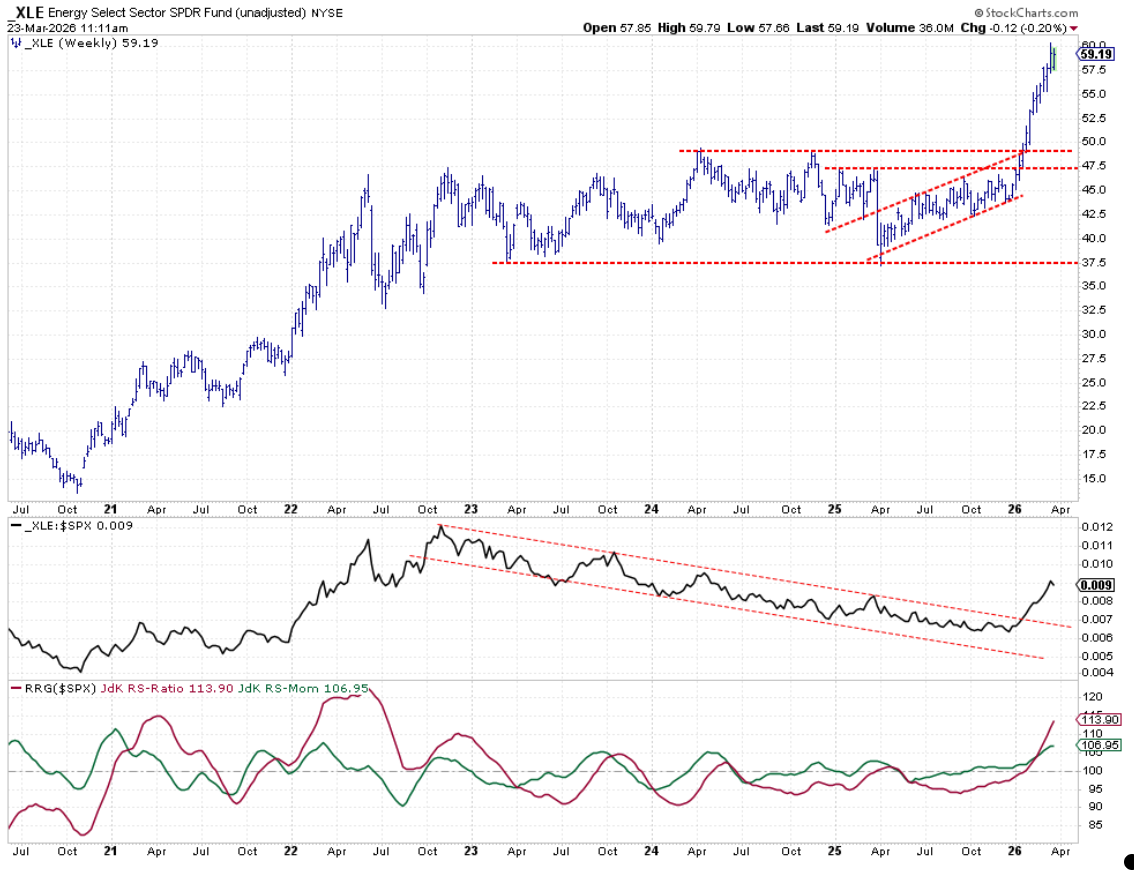
Energy stays strong. Prices rose on Monday and are near the top of last week’s range. Both strength lines are well above 100, confirming the sector’s vigor.
Materials
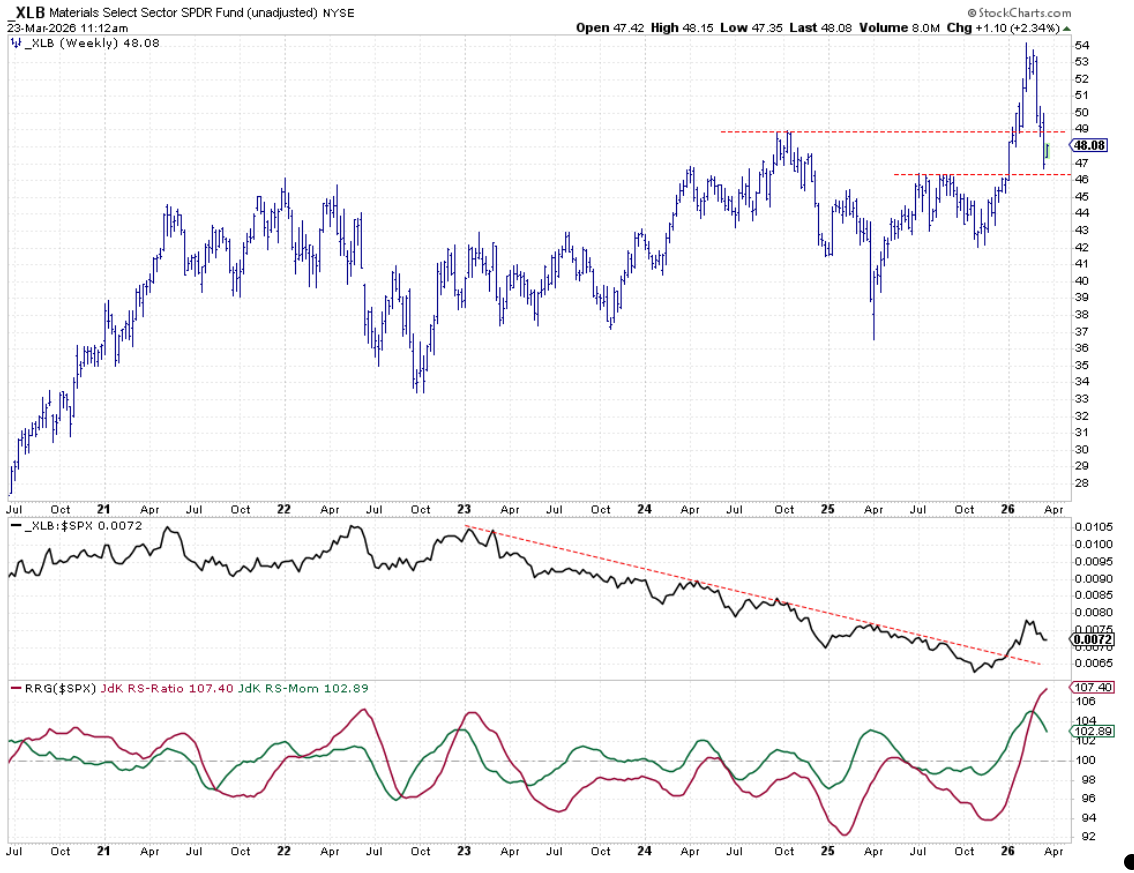
Materials fell below its first support level (just under $49) and now sit above the second level (around $46). The recent drop lowered its raw strength, but the ratio is still high, leaving room for a bounce.
Industrials
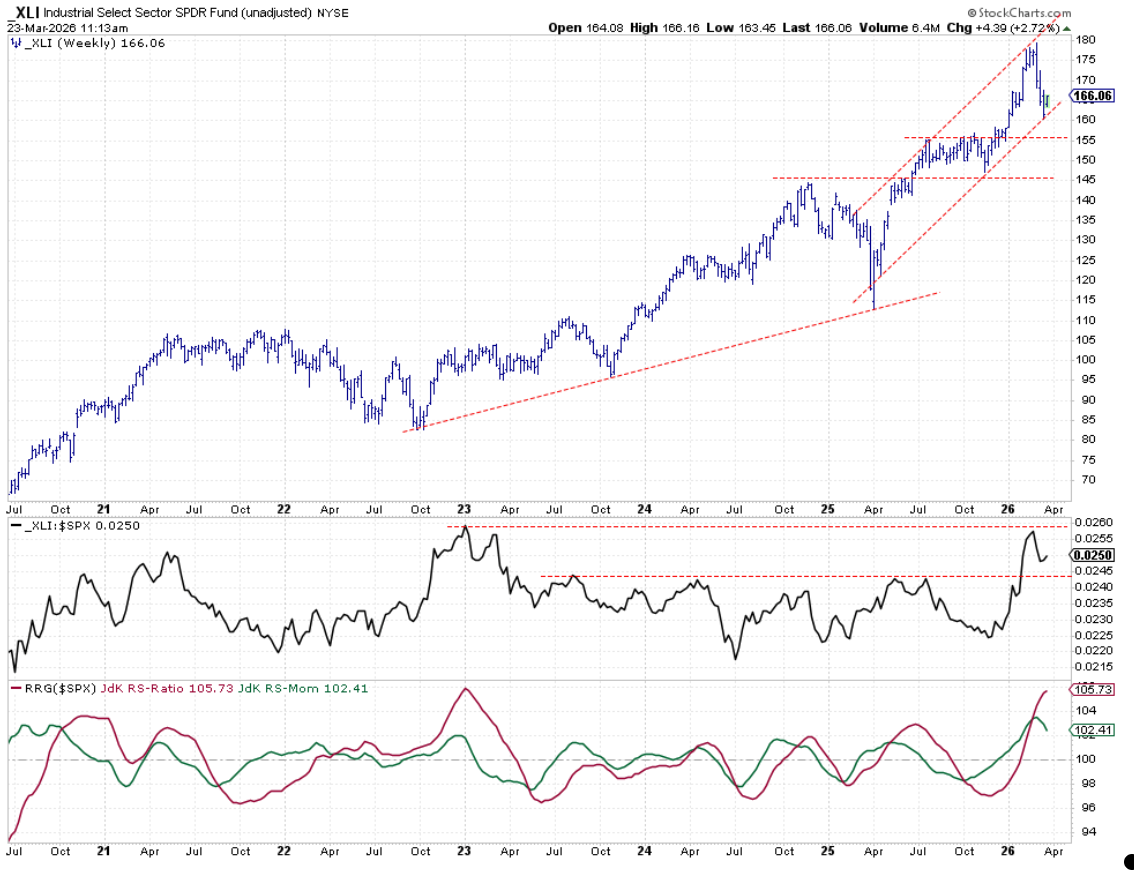
Industrials pulled back from highs near $180 and made a low near $160, forming the bottom of a new rising channel. If that level holds, the sector could climb higher.
Utilities
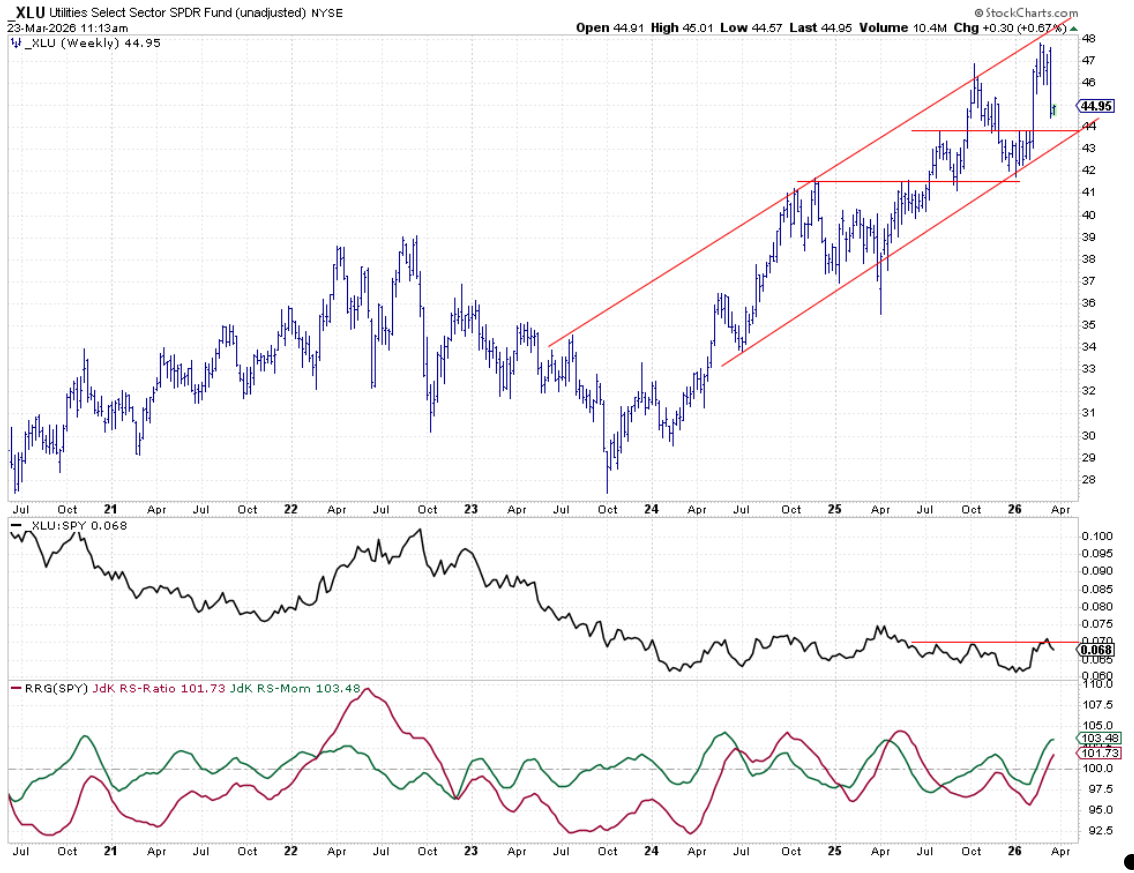
Utilities reached the top of their channel and are now falling. A drop toward $44, where intermediate support sits, is possible.
Consumer Staples
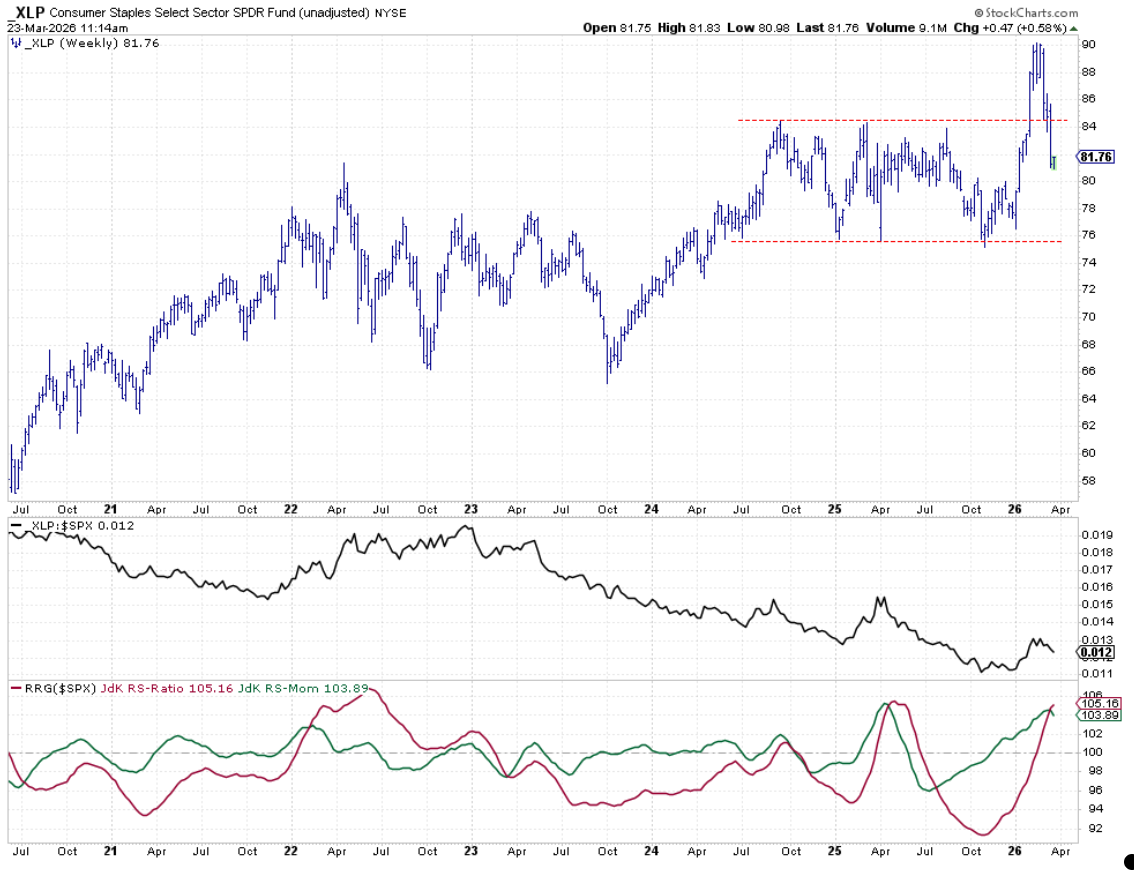
Staples moved back into its older range and sit near the middle. Support is around $80. The strength ratio stays high, keeping Staples in the top‑five list.
Portfolio Overview
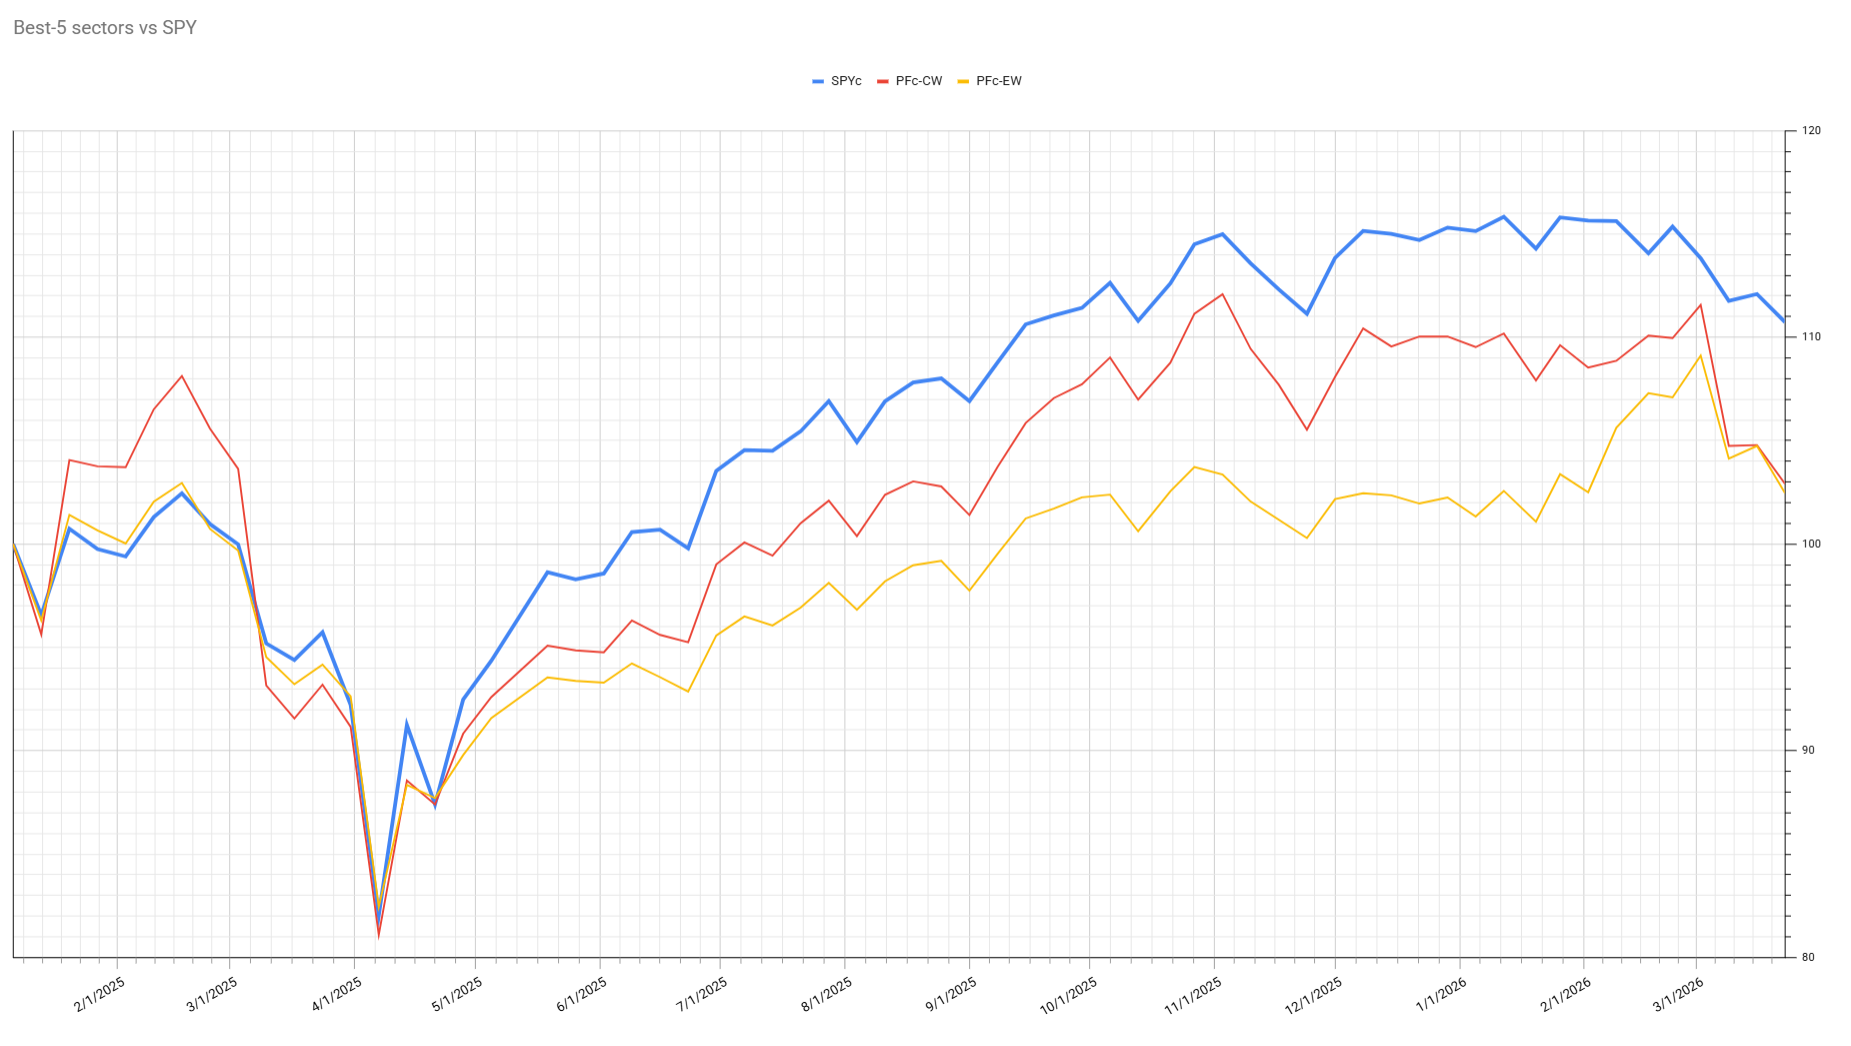
The portfolio has changed little since last week. It is now about 7% below the S&P 500, meaning a new upward move is needed.
Weak overall market conditions and continued lag in Technology, Consumer Discretionary and Financials would help the defensive‑focused portfolio perform better.
Bottom Line
Investors are still favoring defensive sectors. Energy, Utilities and Consumer Staples keep leading the pack. The lagging performance of Technology, Consumer Discretionary and Financials reinforces the cautious tone.
Source: Materials provided by https://articles.stockcharts.com.Note: Content may be edited for style and length.