
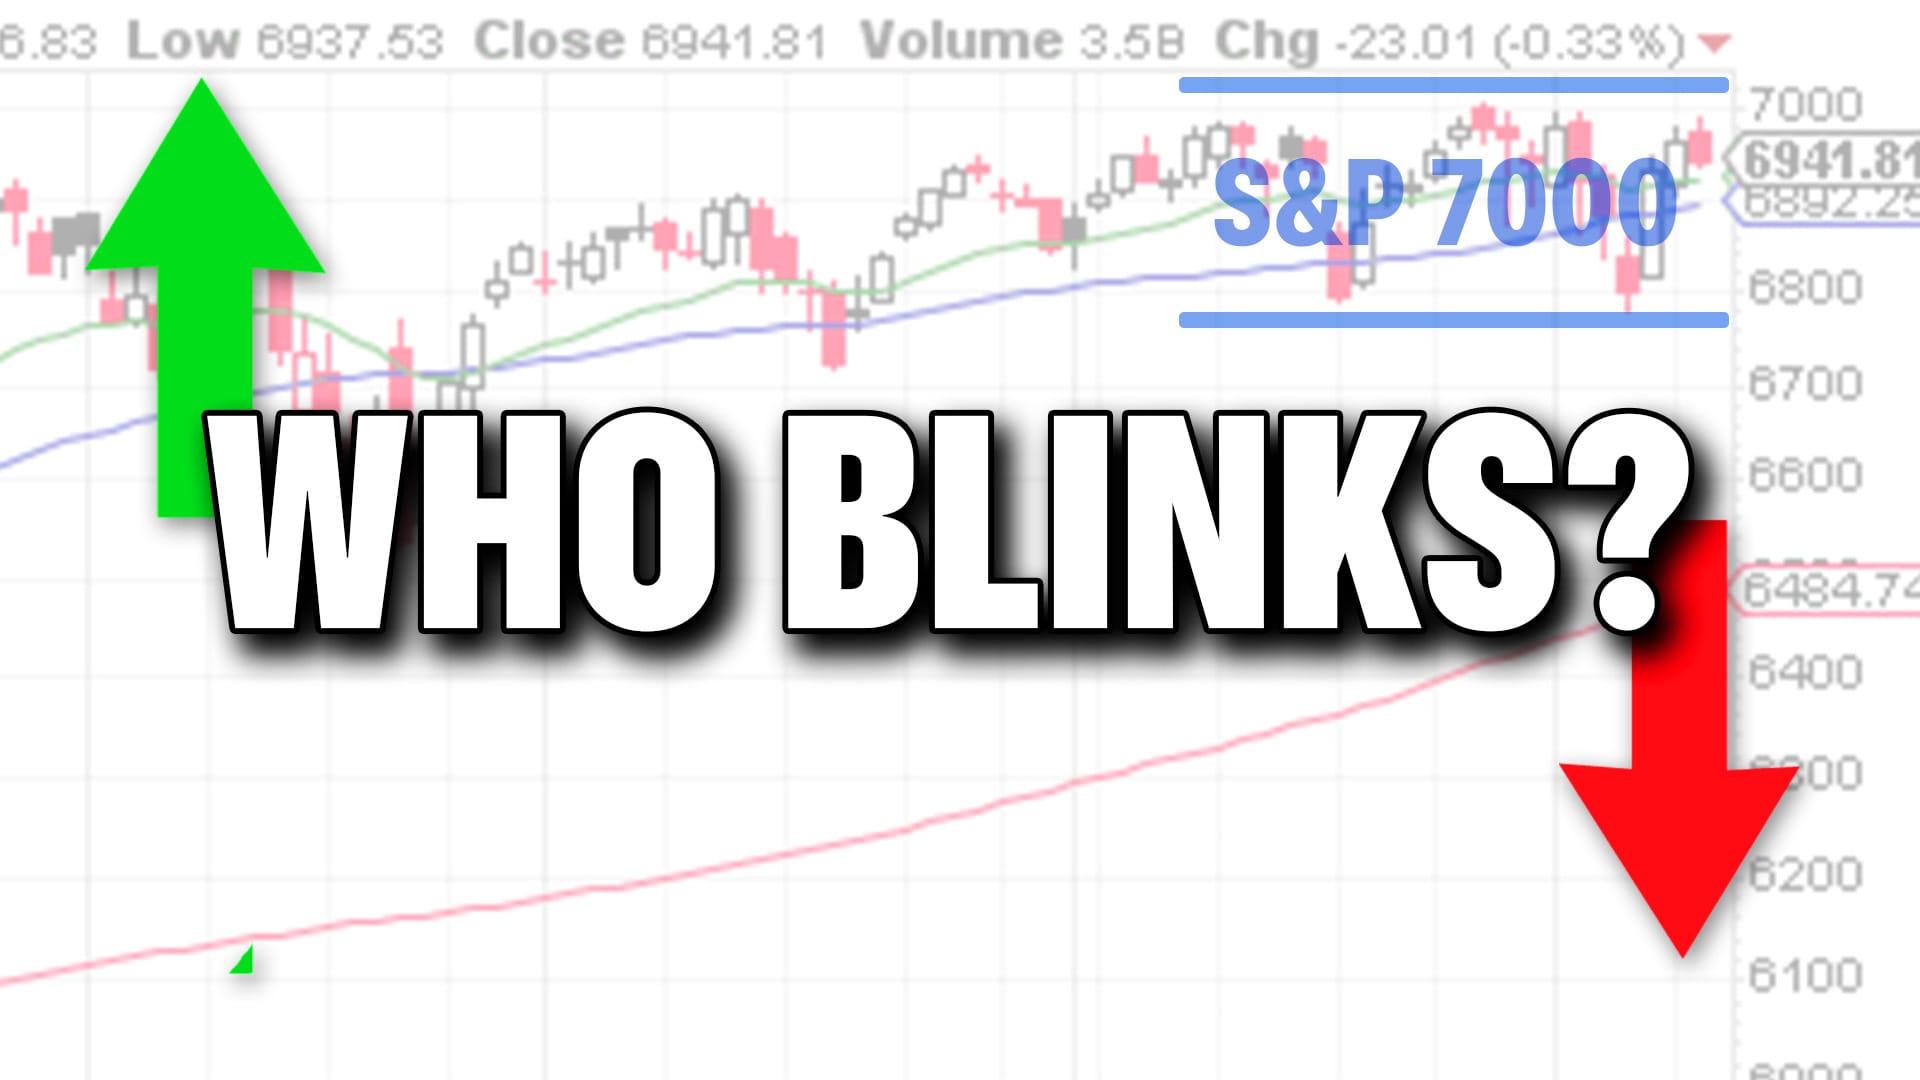
Since early February, the S&P 500 has been locked just below the 7,000‑point barrier. Traders have watched a series of attempted breakouts dissolve into quick reversals, leaving the index hovering in a tight range.
Behind the scenes, the chart still shows a healthy bullish framework: higher highs, a rising trend‑line, and a clear base that hasn’t been torn apart. Yet each time price nudges upward, a wave of fakeouts pops up around the same resistance zone, forcing a pull‑back that buyers promptly defend.
The battle is evident in the indicator arena as well. The GoNoGo oscillator flashes rapid whipsaws, suggesting indecision, while the MACD occasionally drops into sell territory without generating the expected down‑trend momentum. Meanwhile, the RSI is trending lower, but the market breadth is actually widening—a classic divergence that hints at lingering strength.
On the bearish side, several classic reversal patterns have failed to take hold. Head‑and‑shoulder formations and descending triangles have fizzled out, leaving the downside momentum muted.
So what’s the likely path forward? The market could finally break through the 7,000 ceiling if buying pressure outlasts the sellers’ fading resolve. Conversely, a prolonged consolidation may set the stage for a more decisive move—either higher or lower—once the next catalyst arrives.
Source: Materials provided by https://articles.stockcharts.com.Note: Content may be edited for style and length.