Market Summary
The French CAC 40 cash index finished the session 0.70% higher, ending at 8,124.88 points with an average turnover of €3.666 bn.
Paris‑based equities ended the day in the green, largely thanks to a surge in luxury shares that responded to recent policy signals from China. Beijing announced plans to tighten coordination between commerce and finance, encouraging banks to increase credit for consumer spending on durable goods and digital products. The move also aims to broaden access for foreign offerings in the domestic market.
Luxury names reacted positively: Kering rose 2.65% to €304.05, L’Oréal gained 0.85% to €373.20, Hermès added 0.84% to €2,152, and LVMH climbed 0.45% to €627.30.
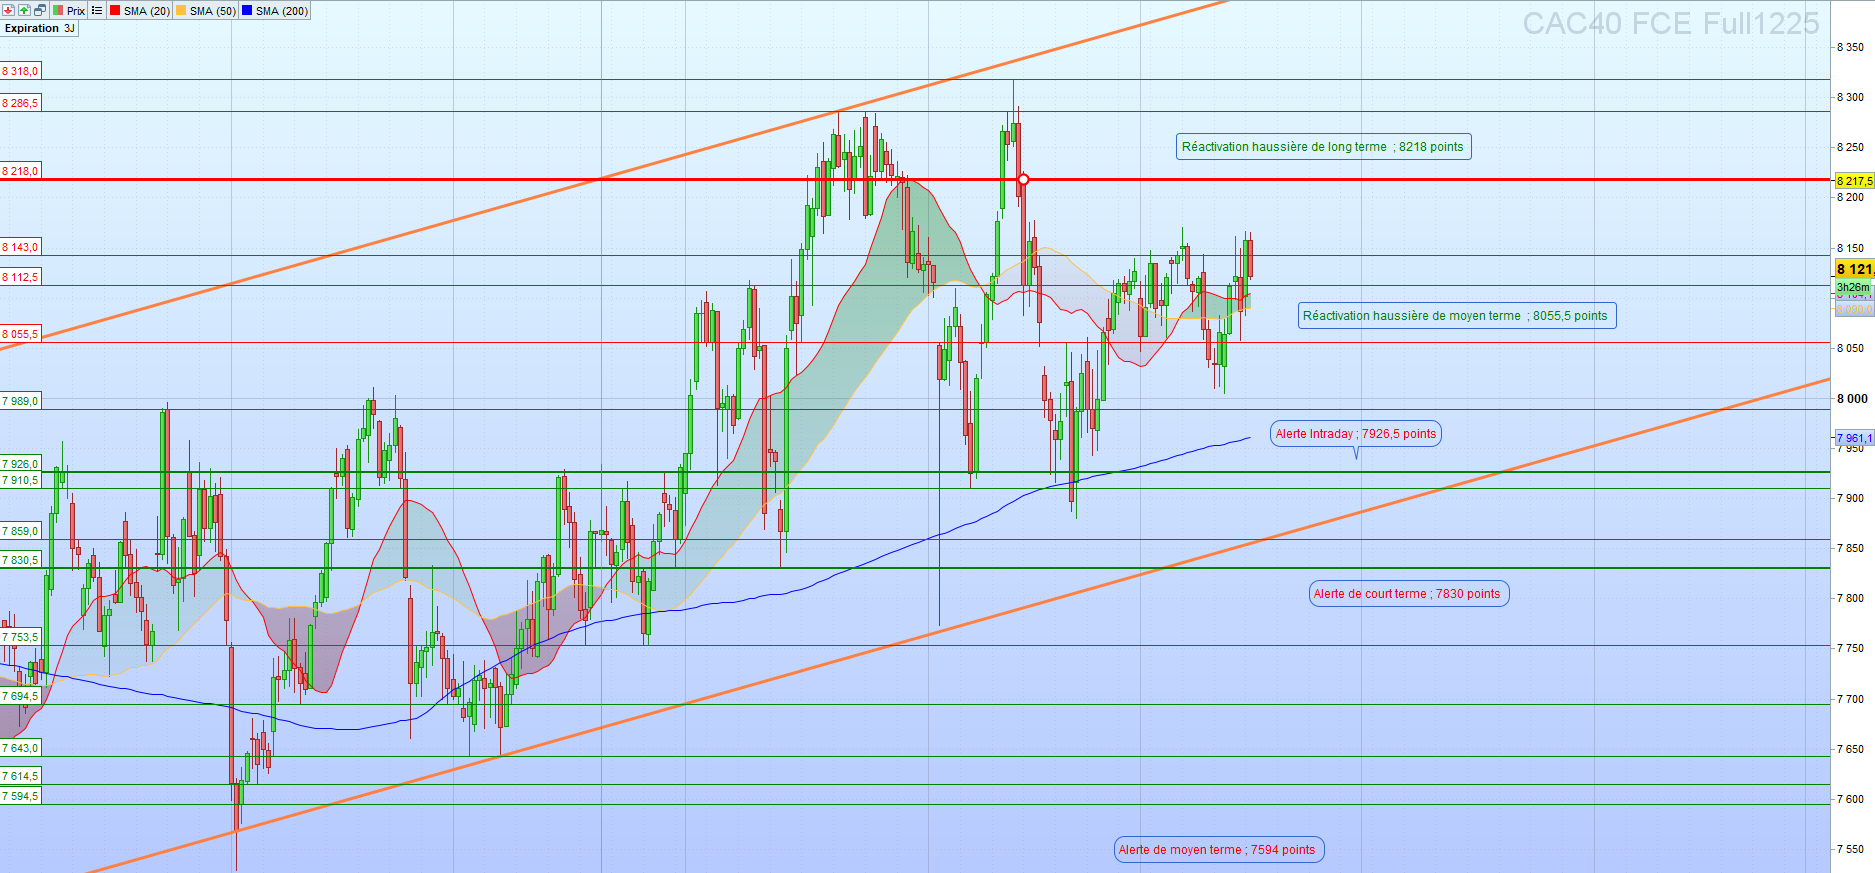
December Futures – Key Levels
Resistance zones: 8,055.5 – 8,112.5 – 8,143 – 8,218 – 8,286.5 – 8,318 – 8,408.5
Support zones: 7,989 – 7,926 – 7,910.5 – 7,859 – 7,830.5 – 7,753.5 – 7,694.5 – 7,643 – 7,614.5 – 7,594.5
Intraday bias stays bullish as long as the index trades above 8,115 points.
Technical Perspective
At the 14:00 snapshot, the CAC 40 future maintained its medium‑term uptrend, staying above the 8,055.5‑point threshold. A decisive rally would require a fresh wave of buyer flow that pushes through the major resistances at 8,218 and then 8,286.5 points. Three consecutive closes beyond the latter would likely drive the index toward the upper channel edge around 8,360 points, a break that would confirm a strong upward momentum.
Conversely, a close below the 8,055.5‑point technical level would weaken the short‑term bullish bias, prompting a pullback toward the intraday alert zone at 7,926.5 points and, subsequently, toward the lower channel base near 7,811 points. As long as the 7,811‑point floor holds, the long‑term uptrend remains intact. A break beneath this support could accelerate selling pressure, targeting the historic median of the trading range at 7,765.5 points—where the index oscillated between May and October 2025. A clear breach of these markers may open a correction corridor between 7,694.5 and 7,614.5 points, potentially extending down to 7,594.5 points.
From an indicator standpoint, the index sits below its 20‑, 50‑, and 200‑day moving averages. The MACD histogram has turned positive and sits above the signal line, while the RSI hovers around neutral. Volume has increased relative to the previous session, supporting the price action.
Portfolio Takeaway
In line with our strategy, we have modestly increased exposure near the lower edge of the current trading range. The Dynamic portfolio now holds 55% of its allocation in equities, compared with 65% for the Investor portfolio. We remain selective, monitoring market developments closely and standing ready to adjust positions should the trend show signs of weakening.