

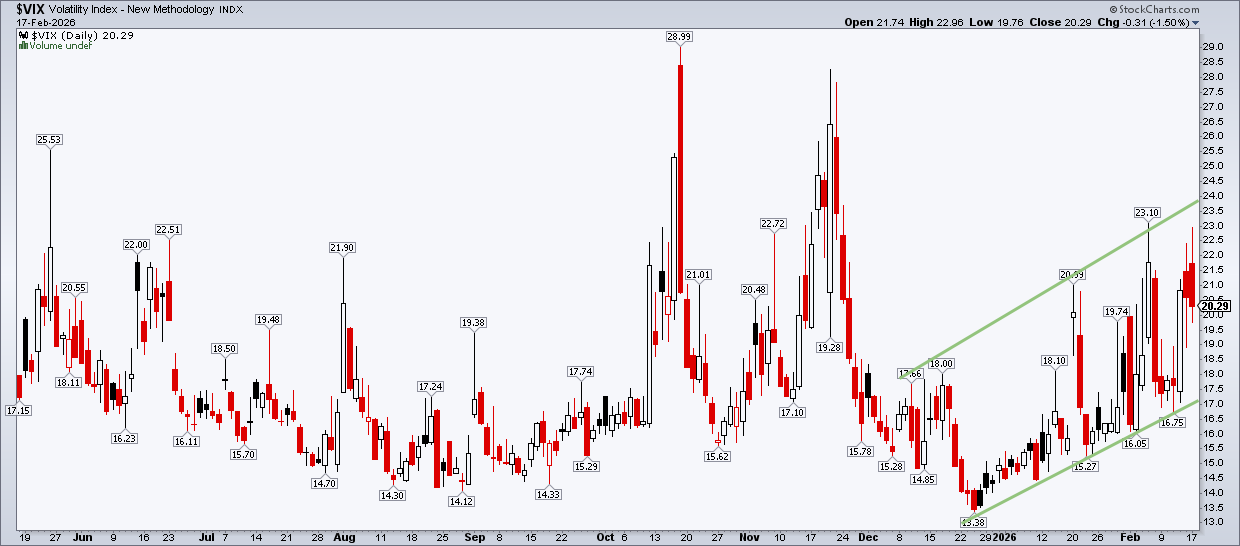
Investors are quietly watching the Cboe Volatility Index as it nudged above the 20‑point threshold this week. While the gauge isn’t soaring to historic highs, a reading in the low‑to‑mid‑20s often precedes sharper moves in the broader market.
Why the Current VIX Level Matters
When the VIX settles around 20, the market is neither complacent nor in panic mode. History shows that the S&P 500 tends to be more vulnerable to corrections during this range, especially if the index stalls below key resistance zones such as the 7,000 level.
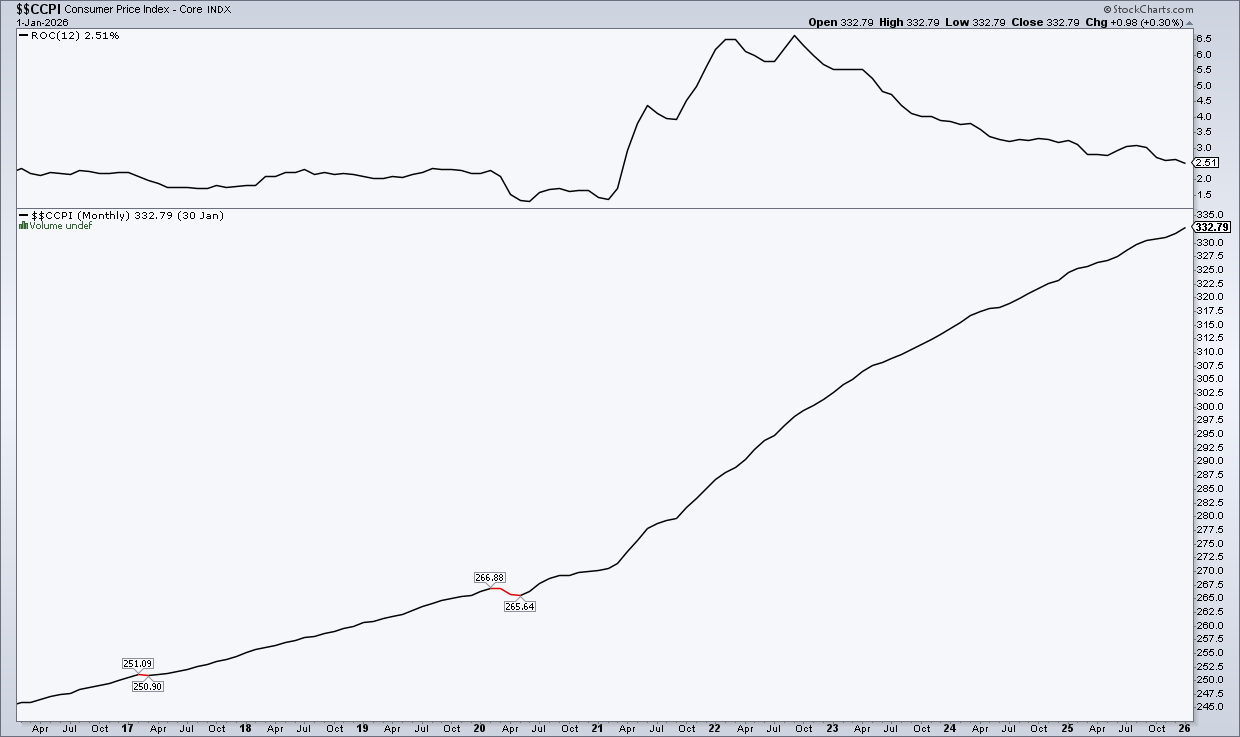
The recent uptick arrived without a flood of headline‑making data. December employment numbers and January inflation reports produced mixed reactions across equities and bonds, while weaker retail sales hinted at a softer consumer backdrop.
Upcoming Data That Could Nudge the VIX
Mid‑week releases—including revised CPI and retail figures—usually don’t generate dramatic spikes in volatility. However, a delayed January Retail Sales release and a postponed PCE index could keep the VIX within its 30‑day window of sensitivity.
Potential legal developments, such as a Supreme Court decision on recent tariff disputes, may also act as short‑term catalysts for the fear gauge.
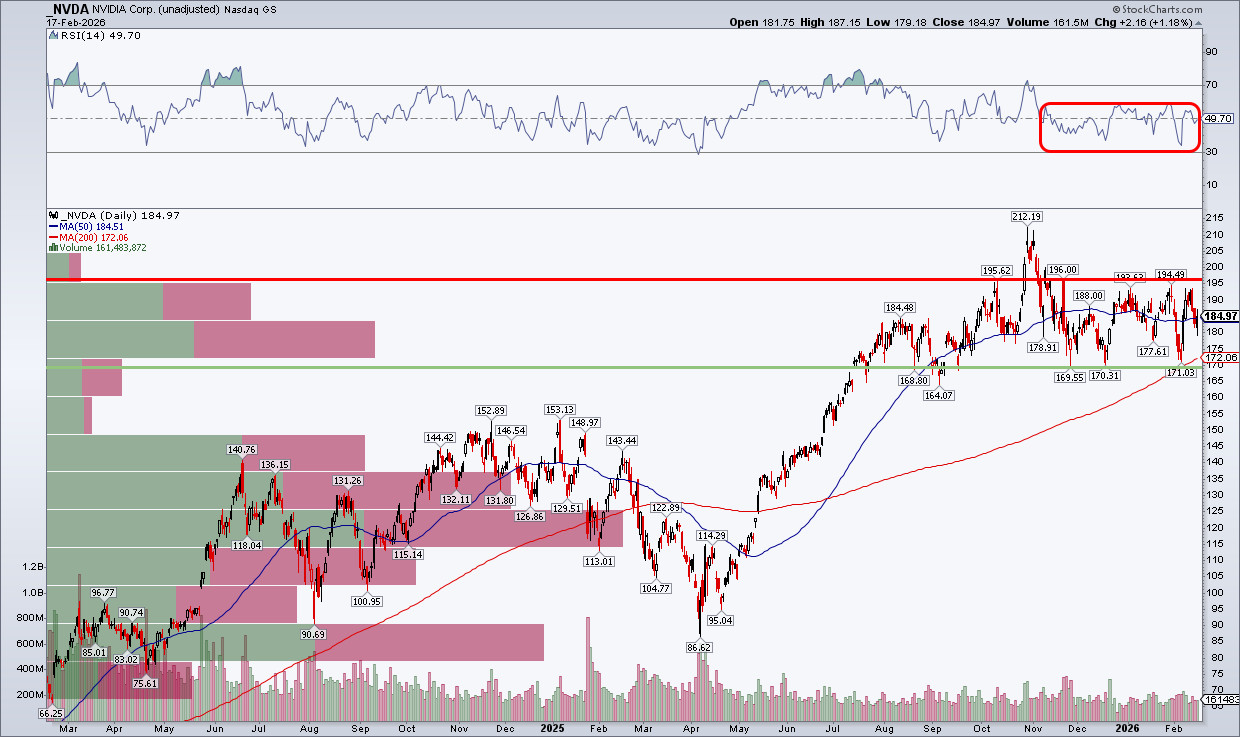
NVDA Earnings: A Near‑Term Volatility Driver
The most immediate market event is Nvidia’s fourth‑quarter earnings report. Options traders are pricing a modest 6‑7% move, which aligns with the chip‑maker’s three‑year historical implied swing. Nvidia’s price has been confined to a $170‑$195 corridor, keeping its own volatility in check ahead of the results.
Fed Meeting on the Horizon
The Federal Reserve’s March policy meeting falls squarely inside the VIX’s 30‑day window. With market expectations leaning heavily toward a rate‑hold, the real focus will be the Fed’s Summary of Economic Projections and the updated dot‑plot, which could reshape risk sentiment.
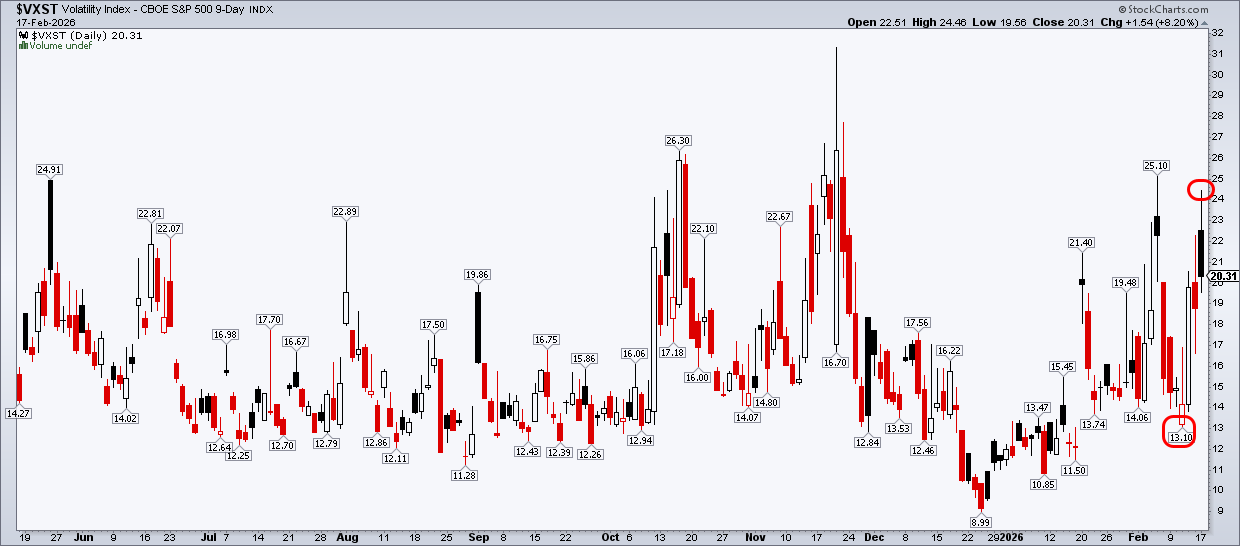
Short‑Term Volatility Gauge: The 9‑Day VIX
For a more immediate snapshot, many traders turn to the Cboe S&P 500 9‑Day Volatility Index (VXST). After swinging between 13 and 25 over the past months, it is now hovering in the low 20s, reflecting the same tension seen in the standard VIX.
Seasonal Patterns That Whisper Caution
Historical charts reveal that late February often marks the start of brief pullbacks for large‑cap U.S. stocks. Similar spikes occurred in 2020, 2023 and 2025, each followed by a short‑lived but noticeable decline.
Broad Market Breadth Remains Resilient
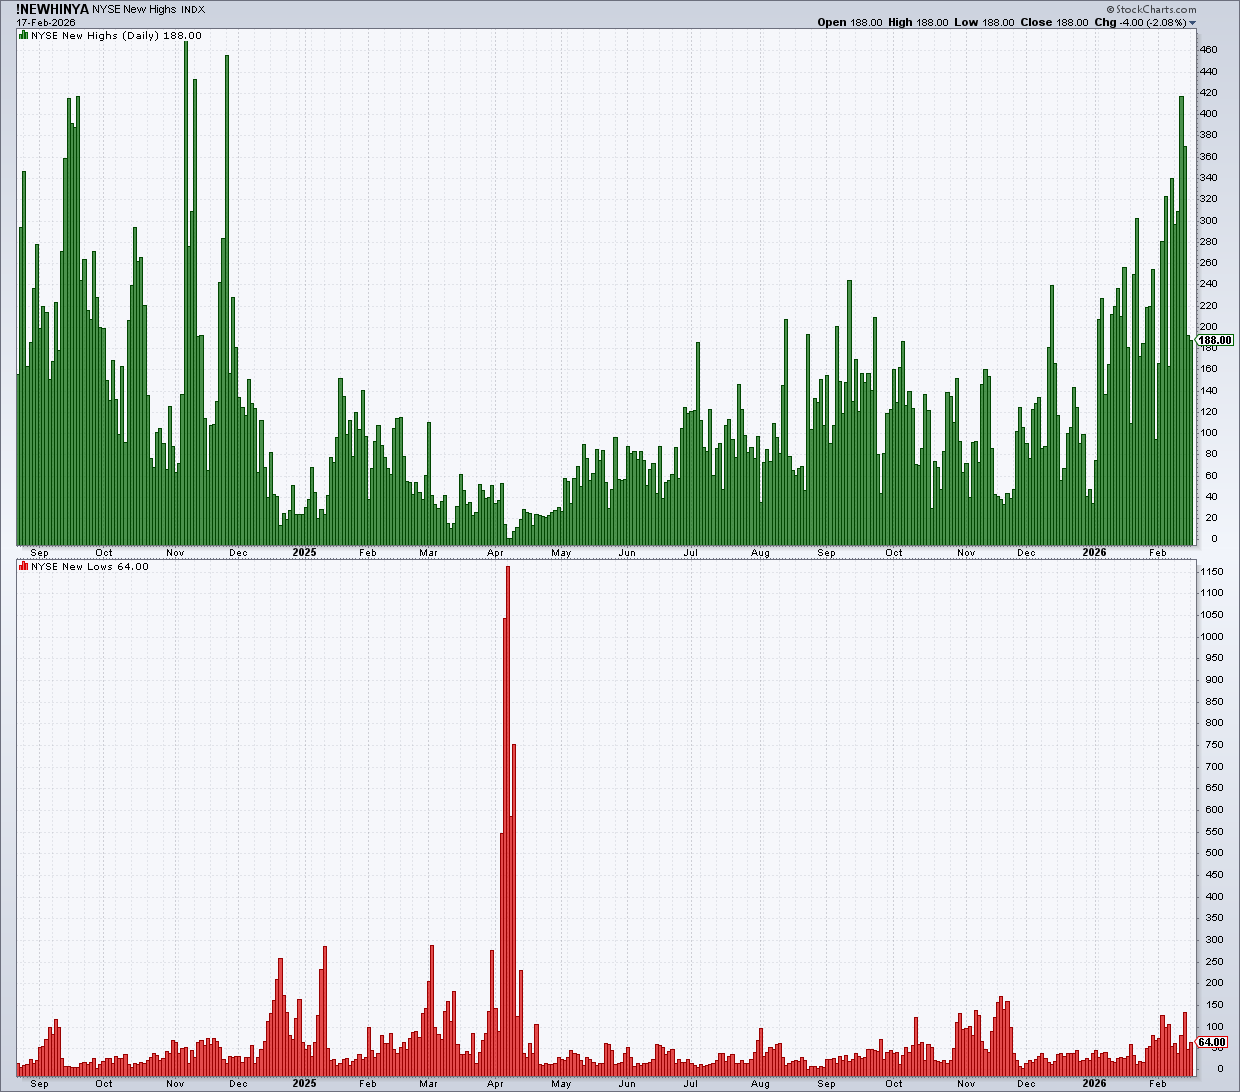
Despite the VIX’s flirtation with the 20‑plus zone, market breadth is holding up. New highs on the NYSE have surged to levels not seen since late 2024, European STOXX 600 equities are posting record gains, and emerging‑market indices stay buoyant.
Takeaway for Traders
The VIX is signaling modest unease rather than panic. Investors should keep an eye on the low‑to‑mid‑20s range, monitor upcoming earnings, and watch the Fed’s policy narrative. Managing exposure with clear stop levels and diversified cues can help navigate the next few weeks of market gyrations.
Source: Materials provided by https://articles.stockcharts.com.Note: Content may be edited for style and length.