

When a high‑profile share such as Palantir (PLTR) or Coinbase (COIN) plunges sharply, investors wonder whether the decline is a trap or the start of a lucrative bounce. Chasing a bottom without evidence can be costly, but a well‑rounded technical toolbox can reveal genuine turning points.
Below we walk through three recent cases—Alaska Air Group (ALK), Palantir, and Coinbase—showing how momentum divergences, moving‑average breaks, and RSI cues work together to separate true reversals from false hopes.
Alaska Air Group: A Classic Change of Character
By late 2025 ALK was tracing lower lows and lower highs, with each counter‑trend rally stalling near a 21‑day exponential moving average. The October‑November lows lined up with a deep low from April 2025, hinting at a possible bottom formation.
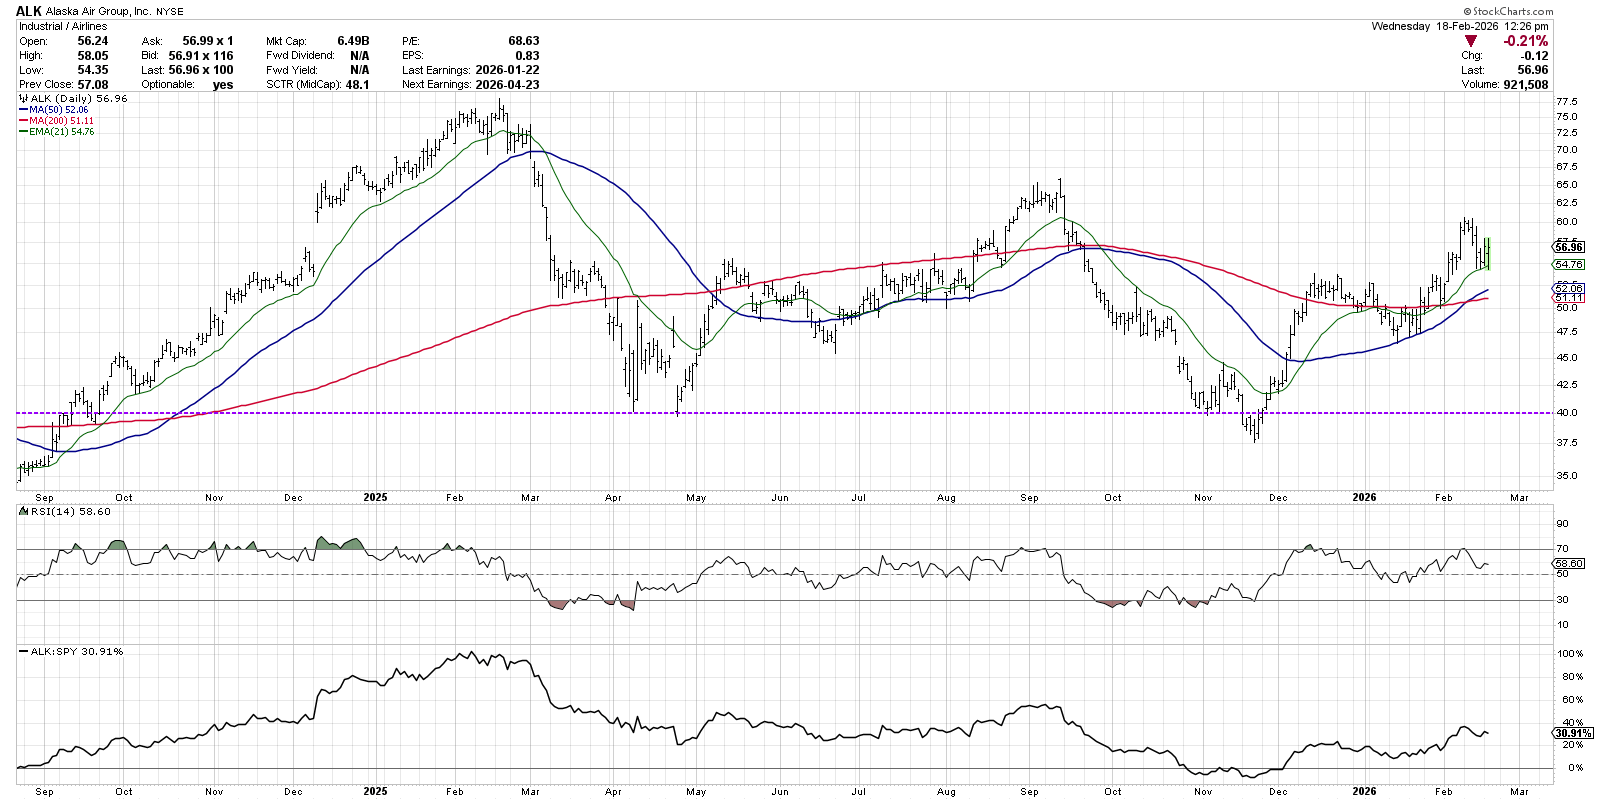
A higher RSI reading at the second November low created a bullish momentum divergence—price fell while the oscillator rose. Shortly after, the price broke above the 21‑day EMA, then the 50‑day EMA, and the RSI surged past the 50‑ and 60‑level thresholds. Those moves signaled a shift from distribution to accumulation, confirming the bottom.
Palantir: Waiting for the Confirmation
Palantir’s chart showed classic distribution: a December retest of its November all‑time high, followed by a break of moving‑average support and declining momentum. Recently, a low accompanied by a higher RSI suggested a nascent bullish divergence.
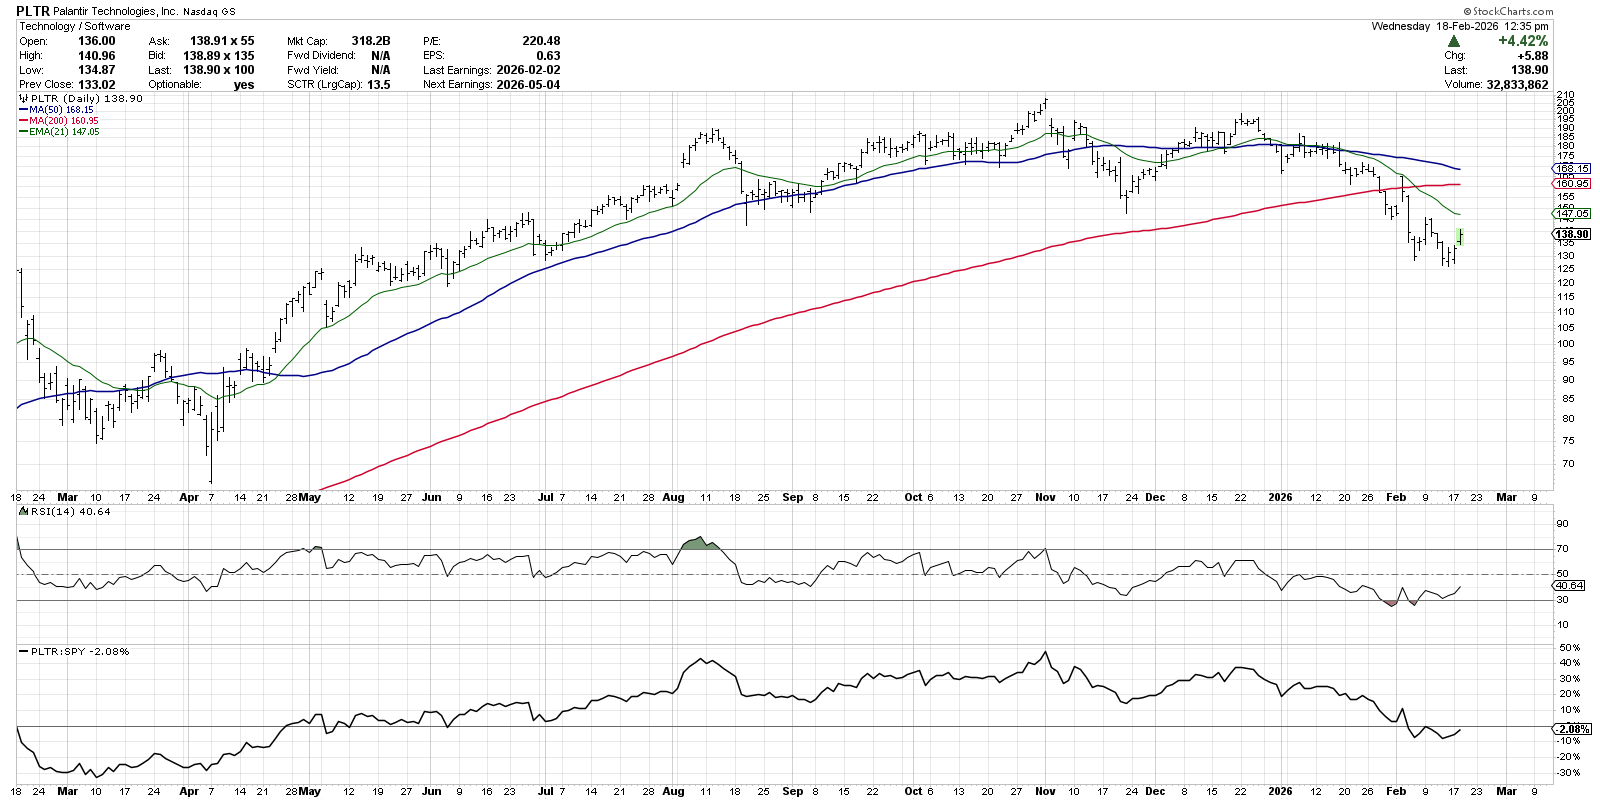
However, PLTR has yet to reclaim the 21‑day EMA, and the RSI remains below the 50 mark. Until the price breaches that EMA and the RSI climbs above 50‑60, the pattern stays “guilty until proven innocent.” Patience is essential; a confirmed break would turn the divergence into a reliable bottom signal.
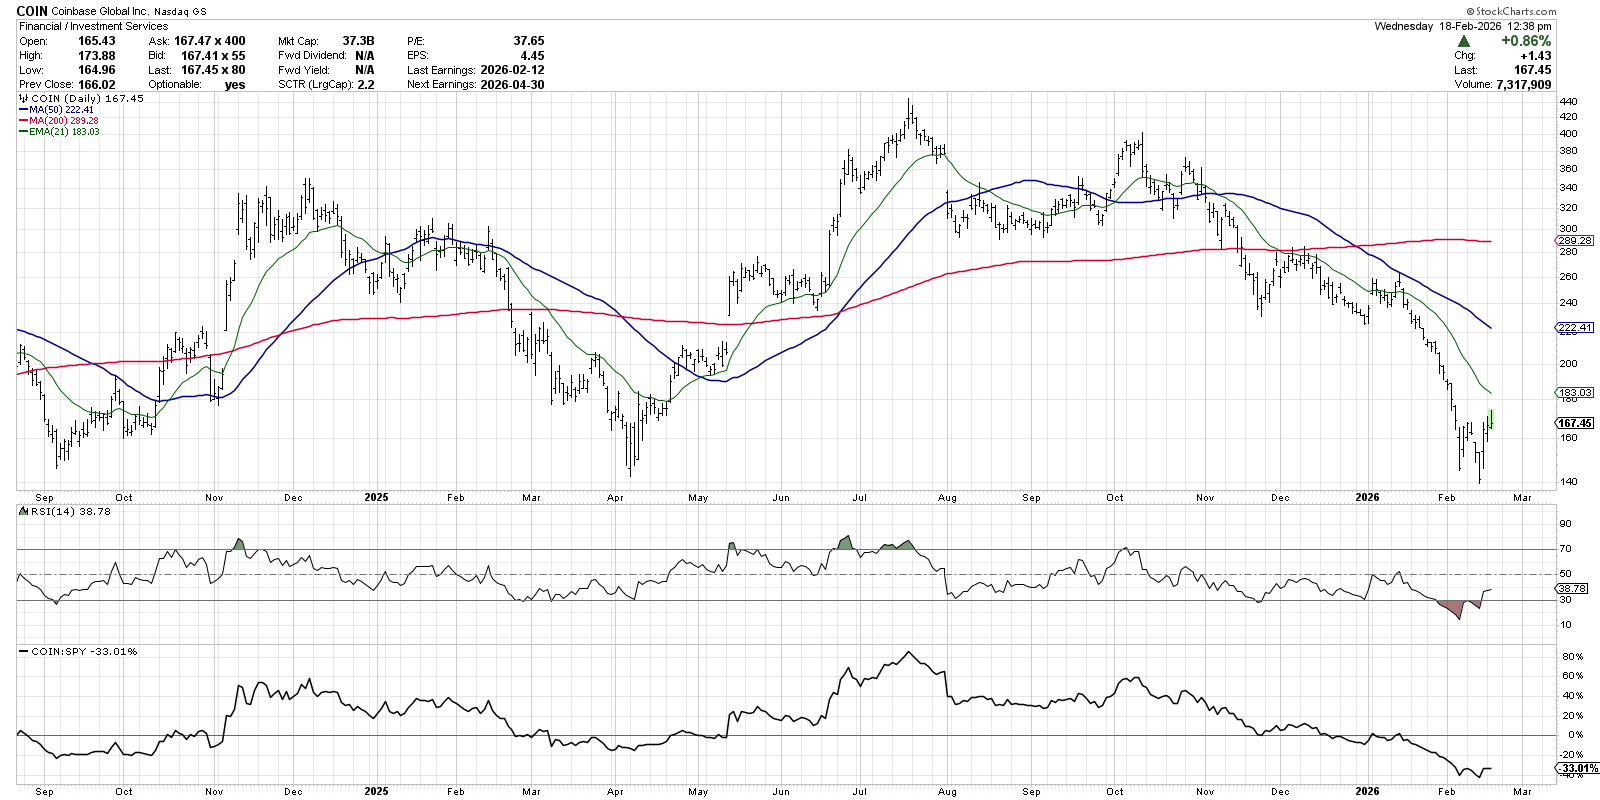
Coinbase: Zooming Out for Context
Coinbase has shed roughly 68 % from its July 2025 peak. A recent rally raised hopes of a bottom, but the daily chart still prints lower lows and lower highs. A short‑term bullish divergence is visible, yet the RSI has not crossed the oversold threshold.
Looking at the weekly timeframe provides extra clarity. The latest low aligns with major troughs from Q1 2025 and Q3 2024, and a hammer candle suggests short‑term buying pressure at support. A weekly PPO crossover, similar to moves that followed the 2024 and 2025 lows, could act as a lagging confirmation of a genuine bottom.
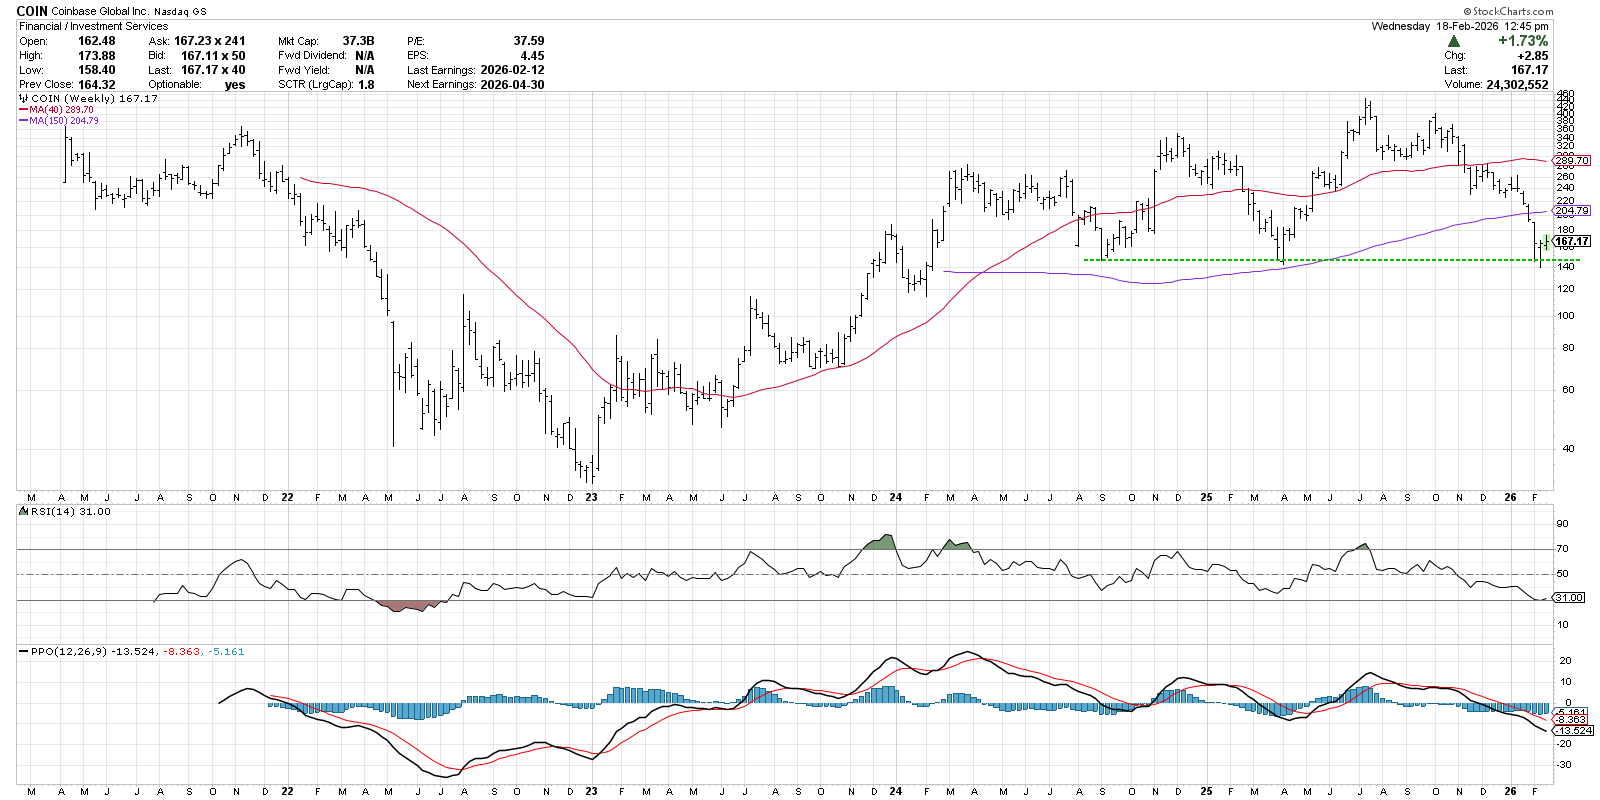
Combining leading indicators (divergence, EMA breaks) with lagging tools (PPO, weekly price action) gives investors a higher probability of catching true reversals while avoiding premature entries.
Disclaimer: This material is for educational purposes only and does not constitute investment advice. Readers should assess their own financial situation and consult a professional before acting.
Source: Materials provided by https://articles.stockcharts.com.Note: Content may be edited for style and length.