

Until mid‑week, the U.S. equity arena was drifting in a narrow range, barely responding to a surprisingly strong jobs report. Thursday, however, snapped that calm with a noticeable sell‑off that caught most traders off guard.
One rough day doesn’t signal a bear market, yet a closer look at the charts reveals a few technical warning signs that merit attention.
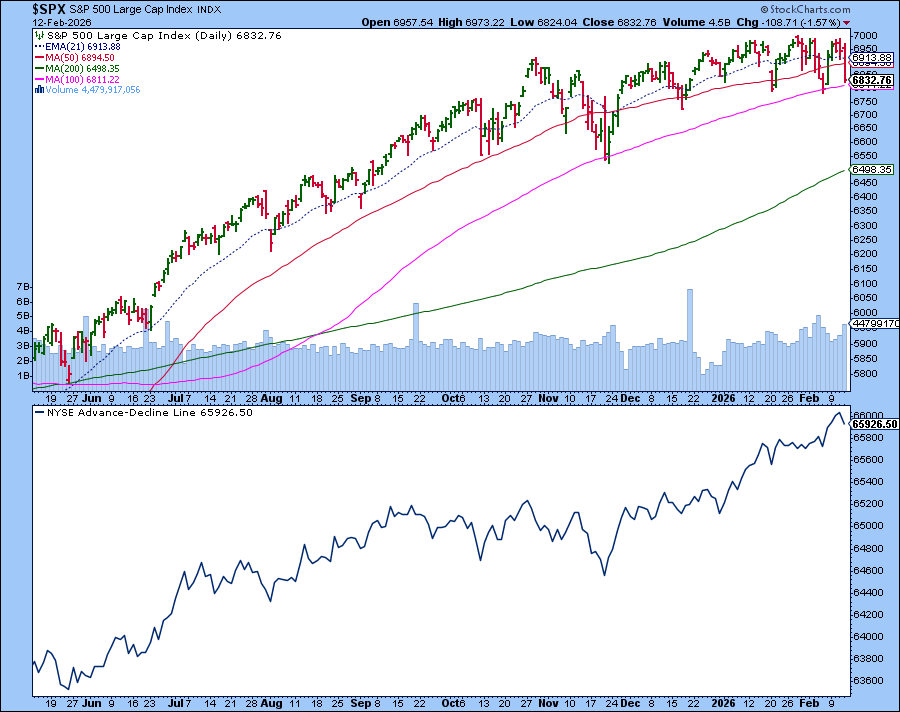
The S&P 500 Approaches a Critical Support Band
The S&P 500 is now flirting with its 100‑day Simple Moving Average (SMA). Historically, the index bounced off this line in November 2025 and again in February 2026. Watching price action around this level can hint at whether buyers still dominate.
Meanwhile, the Dow Jones Transportation Average slipped sharply after a resilient rally, echoing earlier weakness seen in precious metals earlier this year.
Nasdaq Shows Early Signs of Momentum Shift
More concerning is the behavior of the Nasdaq Composite and Nasdaq‑100. While both indices have been range‑bound on longer horizons, they are now trading below their 21‑day Exponential Moving Average (EMA), which itself is tilting downwards. Notably, the 21‑day EMA has just crossed beneath the 50‑day SMA—a classic momentum‑loss signal.
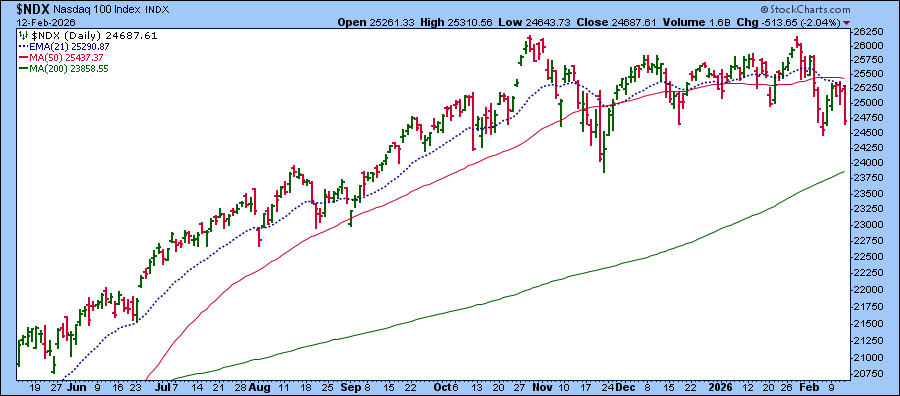
Since October 2025, the Nasdaq 100 has been stuck in a sideways drift. The recent crossover marks the first time this moving‑average relationship has flipped in early February 2026.
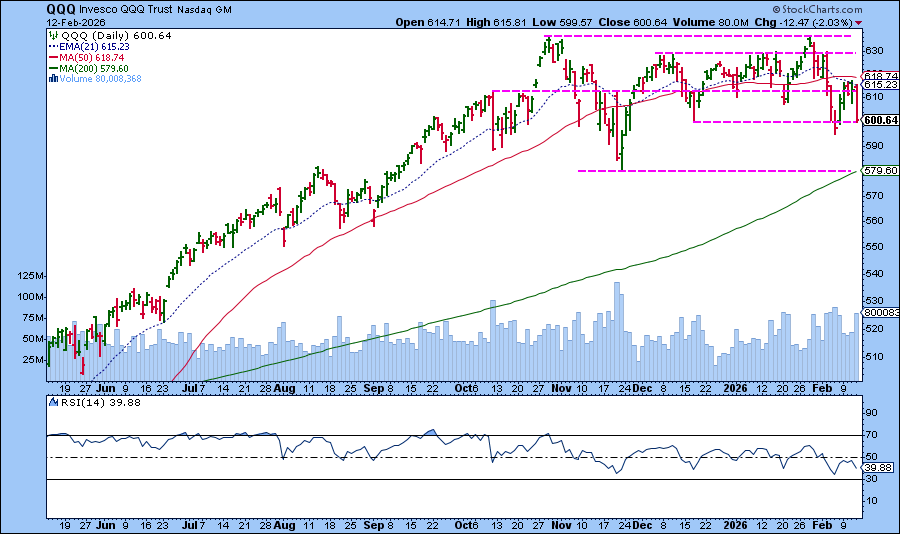
QQQ Hovers Near a Decade‑Low Support Zone
The Invesco QQQ Trust, which tracks the Nasdaq‑100, has kept its 14‑period Relative Strength Index (RSI) within the 30‑70 band since late‑2025, indicating a market that’s neither overbought nor oversold. The chart highlights a cluster of pink dashed lines showing historic support and resistance. As of Thursday’s close, QQQ lingered around the 600‑point mark—a level that also marked its December low. The next move will reveal whether bulls can rebound or bears will push it lower.
What the Breadth Indicators Are Saying
The Advance‑Decline Line continues its upward trend, suggesting that more stocks are advancing than declining across the broader market. Even after Thursday’s dip, the line stayed higher, implying strength outside the large‑cap growth segment.
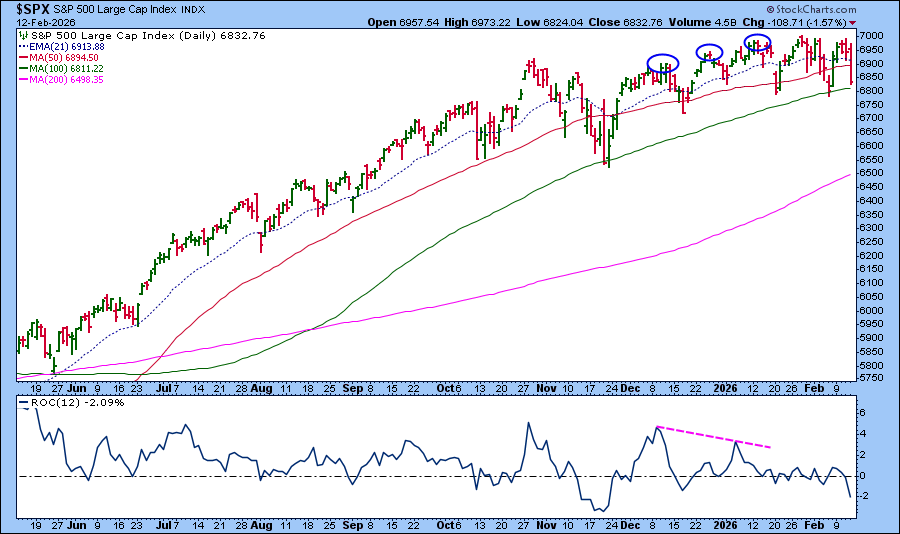
Another subtle signal emerges from the Rate of Change (ROC) indicator on the S&P 500. While the index posted higher highs between December 2025 and January 2026, the ROC was falling—a classic divergence that can precede a slowdown in momentum.
Global Markets Offer a Counterbalance
Outside the United States, emerging markets have outperformed the S&P 500, and many Asian, European, and Latin‑American indices are showing solid strength. Keeping an eye on global snapshots and country‑specific equity funds can provide additional context, especially as the January CPI report approaches.
Key Levels to Watch Moving Forward
Investors should monitor the S&P 500’s 100‑day SMA, QQQ’s 600‑point support, and the overall breadth of advancing stocks. A break of these supports coupled with weakening momentum could usher in heightened volatility. Conversely, a bounce with strong breadth might simply label Thursday’s drop as another pullback in a protracted sideways market that began in late October 2025.
Disclaimer: The information provided is for educational purposes only and does not constitute financial advice. Always consider your personal financial situation and consult a professional before making investment decisions.
Source: Materials provided by https://articles.stockcharts.com.Note: Content may be edited for style and length.