

The year‑to‑date data points to a decidedly defensive market environment in 2026. While the broader market leans toward safety, the Invesco QQQ Trust (QQQ) has yet to break lower, and the Nasdaq‑100 breadth indicator remains neither fully bullish nor bearish.
Defensive Sectors Lead the Pack
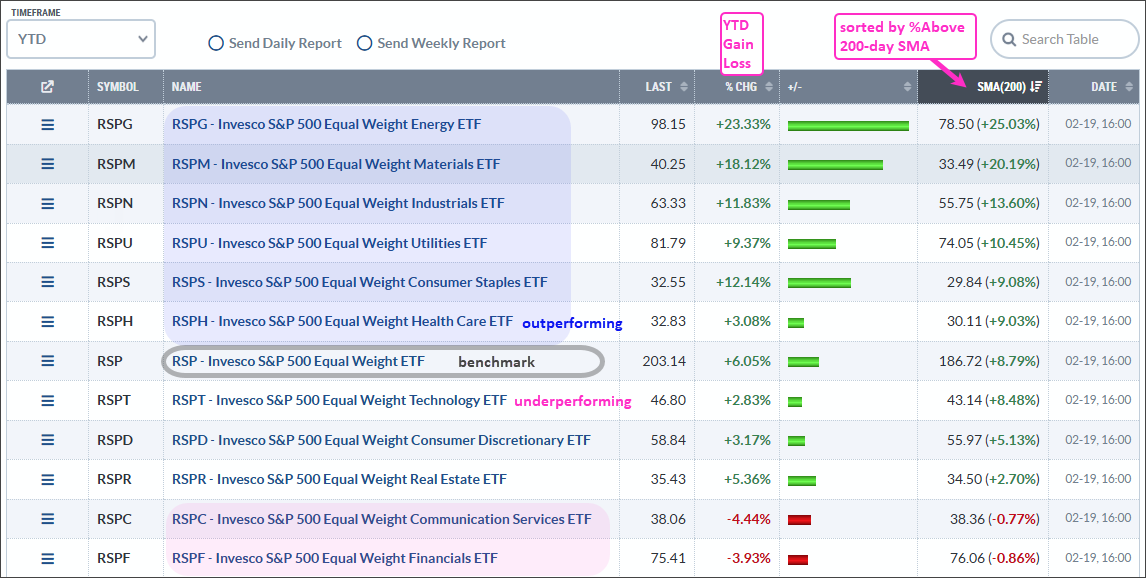
When we examine the equal‑weight sector ETFs against the benchmark Invesco S&P 500 Equal Weight (RSP), a clear hierarchy emerges. Energy, Materials, Industrials, Utilities, Consumer Staples and Health Care sit above the 200‑day simple moving average, signalling stronger momentum. These groups, especially Energy and Materials, typically shine in the late‑cycle phase, while Utilities, Staples and Health Care are classic defensive plays.
Conversely, the more aggressive sectors—Technology, Consumer Discretionary, Real Estate, Communication Services and Financials—trail the leaders. Although they remain above their own 200‑day averages, a break below would likely herald broader market weakness.
QQQ Holds Its Ground Yet Shows Pause
Despite a recent dip in the Nasdaq‑100 Select Equal‑Weight ETF, the QQQ has maintained its long‑term uptrend. A simple long‑term rule can help spot potential turning points: a bullish signal appears when QQQ crosses above its 200‑day SMA while at least 60 % of Nasdaq‑100 components are also above their 200‑day averages; a bearish signal triggers when QQQ falls below its 200‑day SMA and the component percentage drops under 40 %.
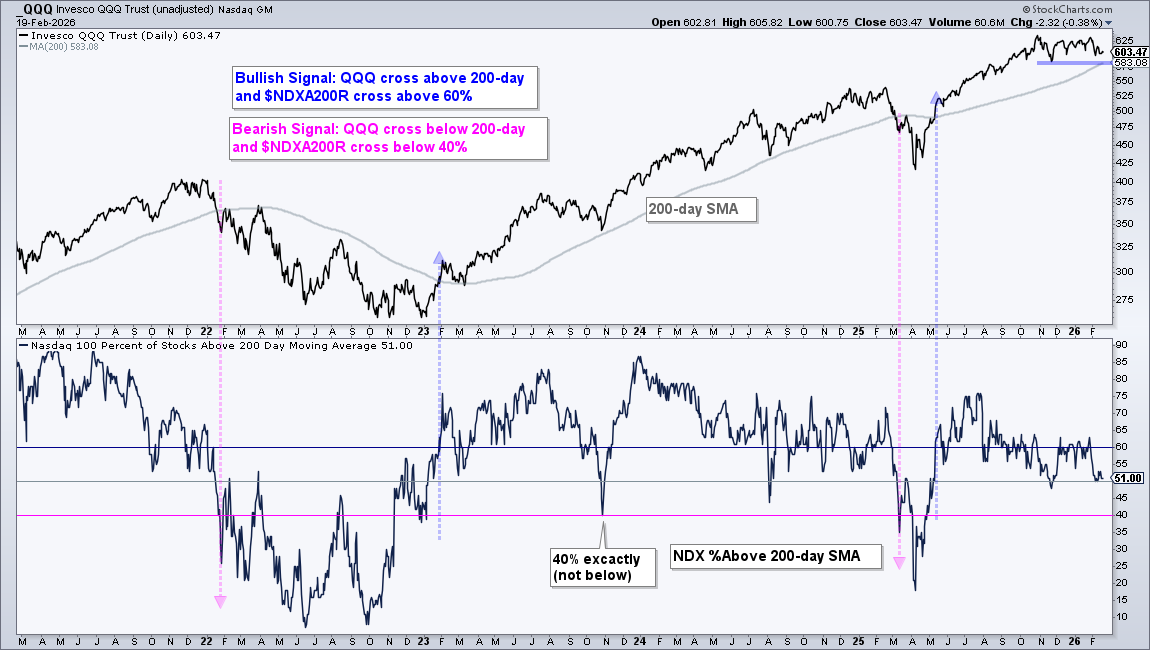
Recent charts show only four such signals over the past five years, underscoring their rarity. The latest bullish signal emerged in early May, keeping QQQ perched above a rising 200‑day SMA. A close below the 583 level would invalidate this support. Meanwhile, the Nasdaq‑100 breadth sits near 51 %, indicating a roughly even split between stocks in uptrends and downtrends—a neutral stance rather than a full‑blown bear market.
Source: Materials provided by https://articles.stockcharts.com.Note: Content may be edited for style and length.