Market Summary
The CAC 40 cash index ended the session down 0.36% at 8,398.78 points, trading on modest volume of €3.085 bn.
The Paris market slipped after a fresh all‑time high the day before. Heavy earnings releases set the tone, but the biggest movers were Renault and Airbus, both posting sharp declines. Luxury stocks also drifted lower.
Orange was the standout performer, jumping 7.46% to €18.14 and briefly leading the index. The telecom group beat 2025 expectations thanks to solid growth in Africa and the Middle East, and it unveiled a robust 2026 outlook along with its "Trust the Future" plan for 2028.
Conversely, Airbus fell 6.75% to €187.10 after trimming its production targets for the A320 family amid a supply‑chain squeeze at Pratt & Whitney. The aircraft maker now expects 870 deliveries in 2026, shy of the consensus 880.
Federal Reserve minutes added a cautious note to the mix, with policymakers hinting that monetary easing may be paused and that a rate hike cannot be ruled out if inflation stays stubborn.
February Futures Outlook
Resistance levels: 8,311 → 8,338 → 8,399.5 → 8,470 points.
Support levels: 8,274.5 → 8,247 → 8,216 → 8,182 → 8,116 → 8,045.5 → 8,014.5 → 7,963 → 7,904 points.
Intraday bias remains bearish below the 8,404‑point mark.
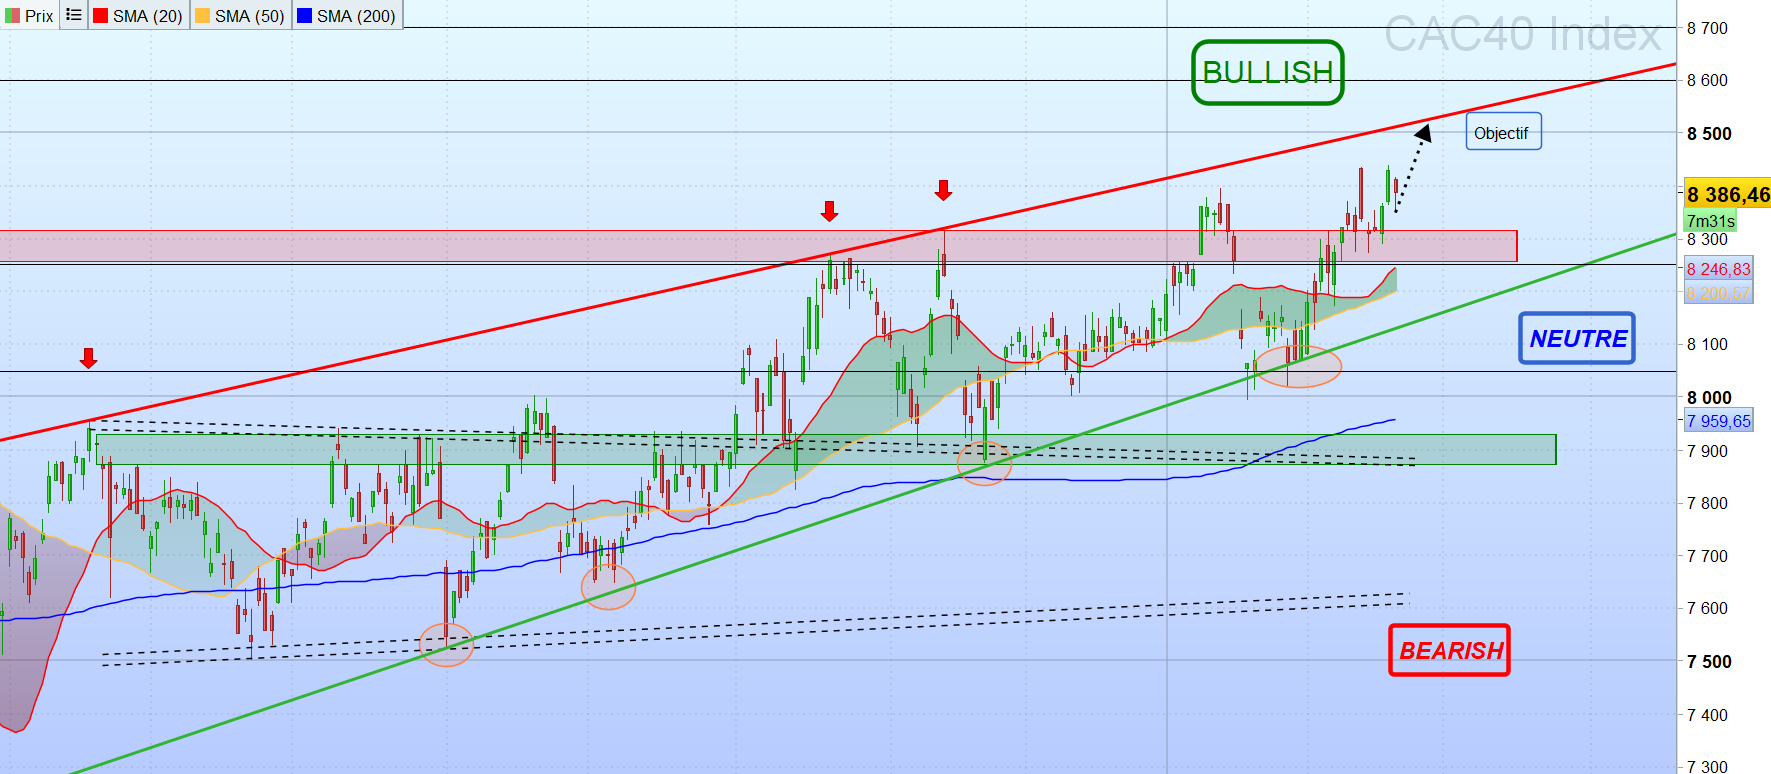
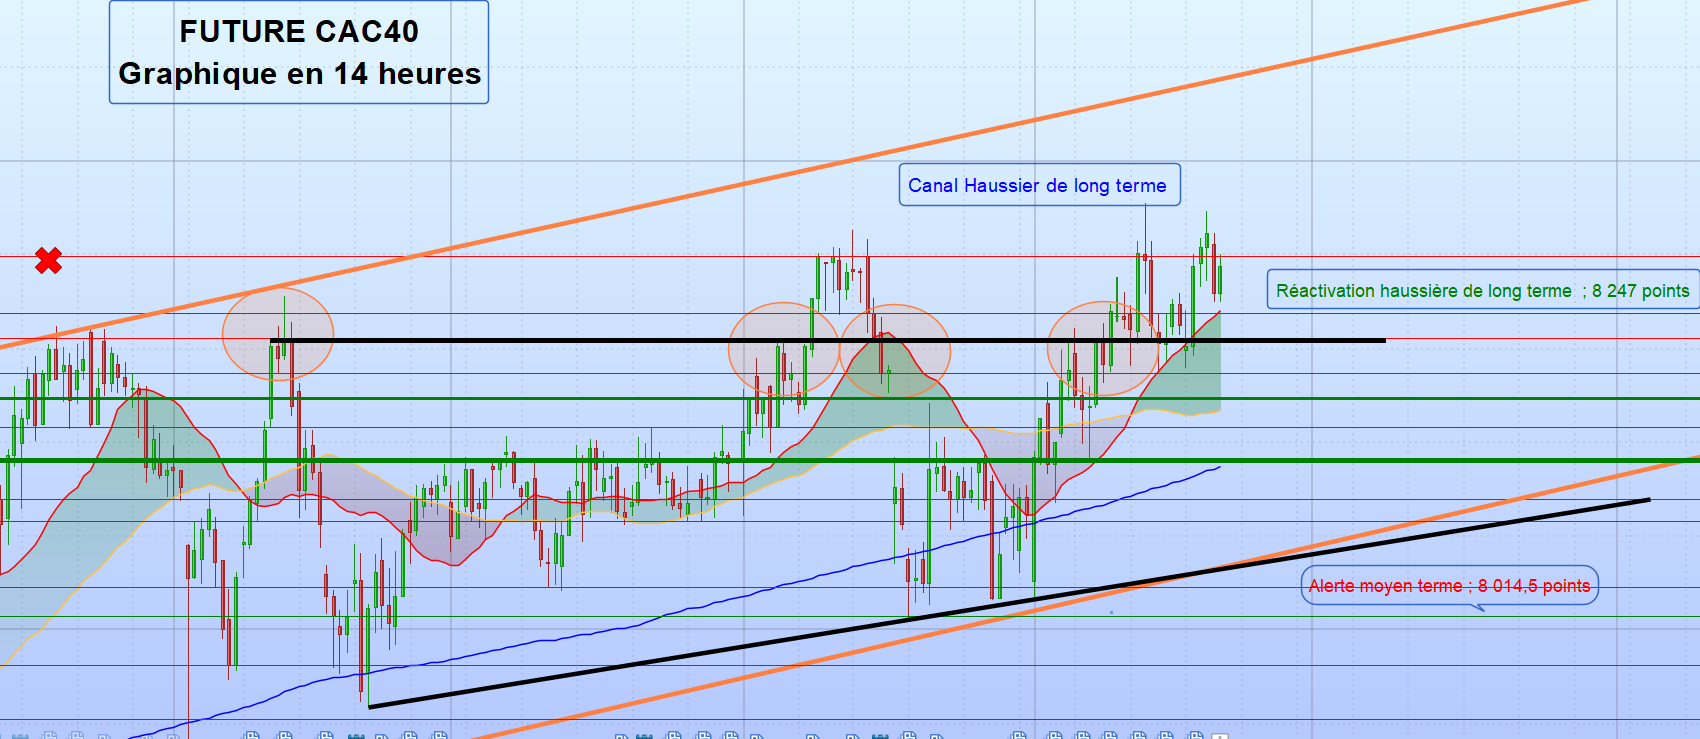
Graphically, the CAC 40 future (data as of 14:00) still shows a slight upward bias after confirming a break above 8,311 points for three consecutive closes. Fresh buying pressure, triggered by new catalysts, would be needed to test the next resistance at 8,338.5 and then 8,399.5 points. The historic peak of 8,454.5 points set on 12 Feb 2026 remains a key level to defend.
On the downside, the index must hold the 8,247‑point zone – a former resistance turned strong support. Without bullish support or in the face of adverse news, the market could retreat to the 8,030 / 8,162 range, indicating a loss of buying momentum. A pull‑back toward the lower channel boundary around 8,014.5 points is plausible; as long as that level holds, the medium‑term uptrend stays intact. A decisive break below would open the door to deeper consolidation near 7,731 and 7,603 points, historic polarity zones.
Technical indicators confirm the overall strength: the index trades above its 20‑, 50‑ and 200‑day moving averages, MACD histogram is rising above the signal line, RSI hovers in a neutral zone, and volumes are higher than the previous session.
Takeaway
Traders should monitor the listed support and resistance zones for early signs of a reversal. In a market where clear up‑moves are becoming scarce, we recommend a selective reinforcement of dynamic and investor‑grade portfolios, emphasizing rigorous stock‑picking, reliable technical signals, and a disciplined value selection process.