The CAC 40 index finished the session at 8,148.89 points, up 0.99% on a turnover of €4.05 bn.
The Paris market posted a notable technical bounce, sparked by an unexpected de‑escalation of trans‑Atlantic trade friction. The United States signaled that it would not roll out new tariffs against European partners, a shift that lifted risk appetite across European equities.
Washington’s softened stance followed preliminary talks on Arctic cooperation, including a framework on Greenland. While the details remain vague, the message was clear: no immediate escalation, both commercially and geopolitically. This helped calm investors’ fears of unilateral protectionism.
Institutional cues from the United States reinforced the mood. The Supreme Court underscored the Federal Reserve’s independence, reminding markets that any interference could jeopardise systemic stability. Such reassurance bolstered confidence in the broader monetary framework.
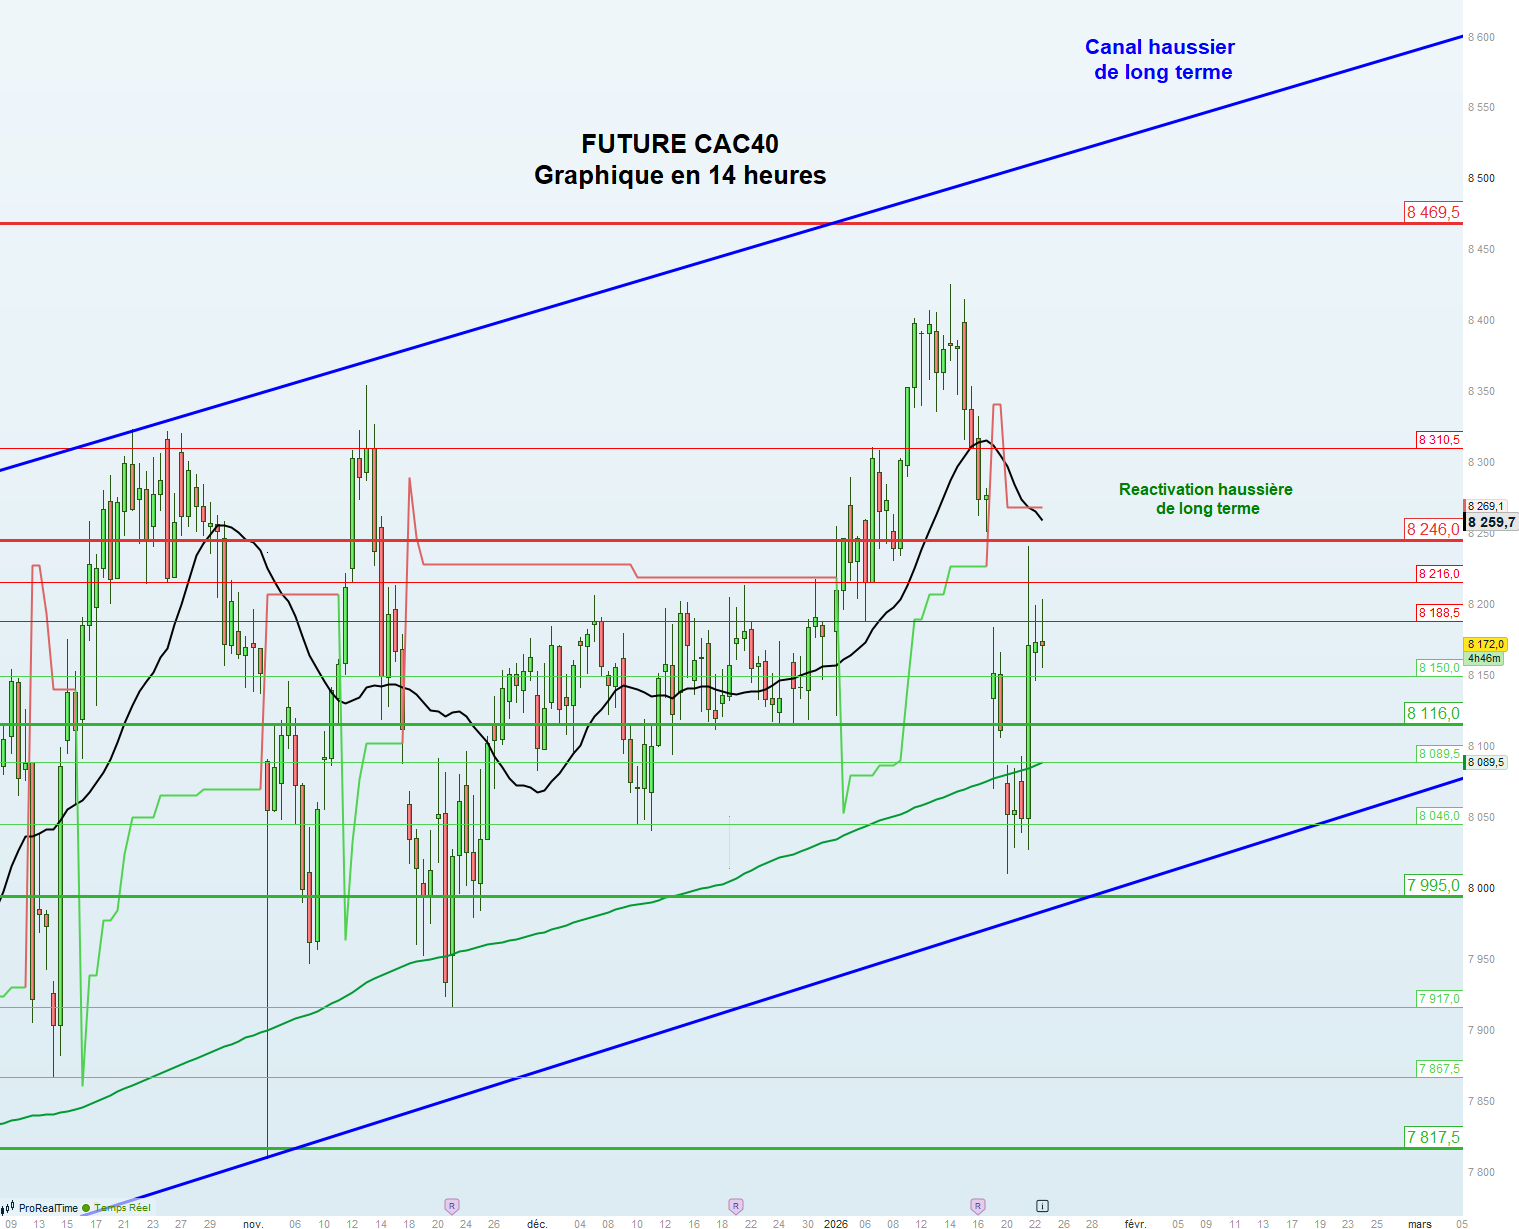
Future CAC 40 – February Contract
Key resistance levels: 8,188.5 – 8,216 – 8,246 – 8,310.5 – 8,469.5 – 8,672 – 8,896 – 9,188 – 8,374.
Important support zones: 8,150 – 8,116 – 8,089.5 – 8,046 – 7,995 – 7,917 – 7,867.5 – 7,817.5 – 7,770 – 7,606.5 – 7,548 – 7,456.5 – 7,303.5 – 7,134.5 – 6,910.
Intraday, the market stays bullish as long as it remains above the 8,246‑point barrier. The chart shows the future contract bouncing off the lower edge of the long‑term upward channel after hitting the theoretical Wolfe wave target at 8,090 points. A breakout through the intermediate resistance at 8,246 points, together with the closing of the gap left at 8,252.5 points on 19 January, would confirm the current recovery.
If the price manages to sustain above these levels, the next target is the upper bound of the long‑term channel, roughly around 8,514 points. Conversely, a decisive break below 8,116 points would expose underlying weakness, potentially pulling the index toward 8,046 and then 7,995 points – the lower edge of the channel that has yet to be tested.
Should the market slip further, it could find resistance around the 7,606‑7,548 point support band. Dropping beneath this zone may trigger a correction towards the 7,134.5‑point “neckline” of a triple‑top pattern, a level that, if broken, would amplify the risk of a sizeable decline.
Strategy outlook: We continue to top‑up the Dynamic and Investor portfolios only when clear chart patterns confirm the move. The Investor portfolio remains partially hedged despite a recent profit‑taking episode, while a short stance on a US index is kept until its reversal structure is invalidated. Any further interventions will be triggered solely by confirmed breaches of the critical technical thresholds identified above.