
CAC 40 closes marginally lower, weekly decline continues
Paris’s benchmark index ended the session down 0.07% at 8,143.05 points, with a turnover of €3.37 billion. Over the past week the index has slipped 2.42%.
The French market wrapped the week on a cautious note. After Thursday’s modest rebound, investors shifted from relief to a waiting game. The backdrop includes a newly announced agreement on Greenland at Davos, which temporarily eased geopolitical tension.
Nevertheless, uncertainty remains. Gold, the classic safe‑haven asset, nudged past the $5,000 per ounce mark this morning, peaking at $4,989.54. The rally reflects lingering geopolitical risks, a softening dollar and doubts about the independence of the U.S. Federal Reserve.
In the Eurozone, the composite Purchasing Managers' Index (PMI) held steady at 51.5 in January, buoyed by a modest industrial rebound despite weaker services. Across the Atlantic, the U.S. composite PMI registered 52.8, indicating continued expansion.
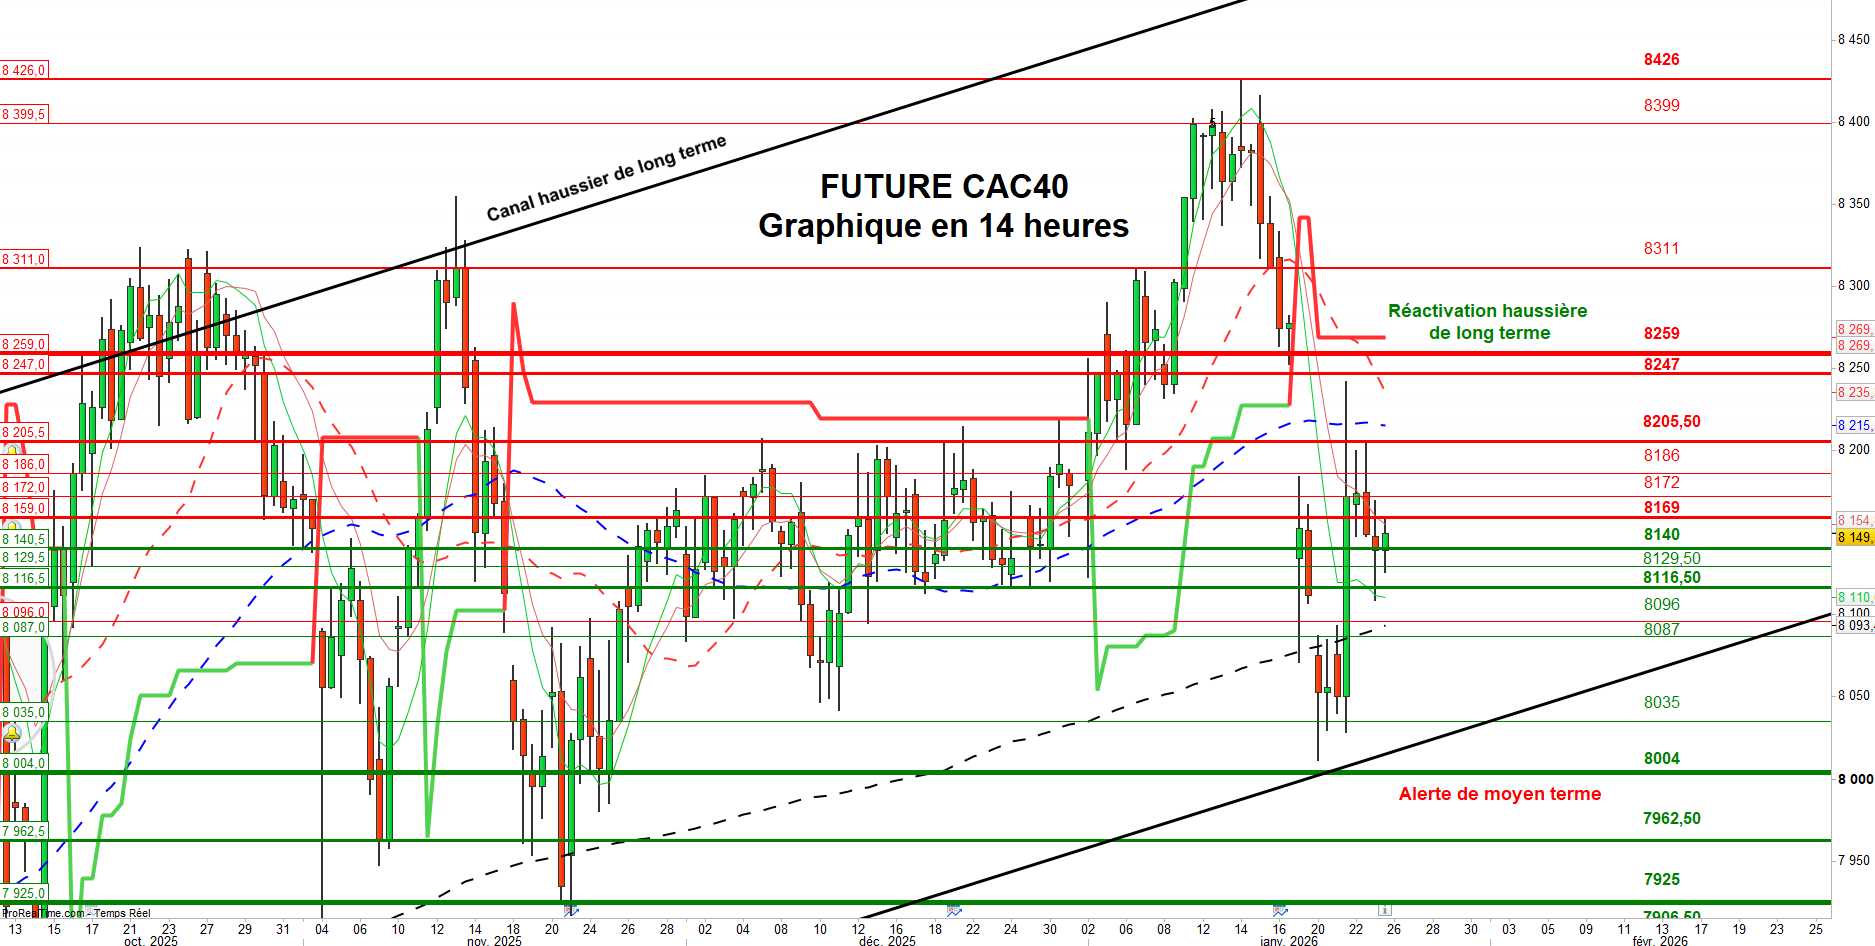
February Futures: Key Levels
Resistance zones: 8,169 – 8,188.5, 8,216, 8,246, 8,310.5, 8,469.5, 8,672, 8,896, 9,188, 8,374.
Support zones: 8,140, 8,116, 8,089.5, 8,046, 7,995, 7,917, 7,867.5, 7,817.5, 7,770, 7,606.5, 7,548, 7,456.5, 7,303.5, 7,134.5, 6,910.
On a intraday basis, the bias stays bullish as long as the index remains above the 8,080 threshold.
Technical snapshot
The February CAC 40 future (14‑hour chart) shows a fragile recovery after Thursday’s bounce. The market closed a short‑term bearish gap from the 20 January continuation pattern, then opened a bullish gap between 8,090.49 and 8,142.44. That gap has only been partially filled, highlighting persistent indecision.
For the rally to turn into a genuine upward trend, the break‑away gap from 19 January (8,190.08 – 8,234.27) must be closed. Achieving that would set the stage for a return toward early‑year highs.
On the indicator side, the MACD histogram stays in positive territory, while the RSI has settled in a neutral zone. Trading volume remains below its recent average, suggesting limited participation.
Bearish scenario
A close below the 8,116.5 level, combined with a full fill of the 22 January bullish gap (under 8,090), would signal that sellers are back in control. That outcome could trigger a slide toward the long‑term descending channel floor near the 8,000 mark. A sustained break below this major support — confirmed by two to three consecutive sessions — would likely restart a deeper corrective phase, echoing the test on 20 January.
Strategic outlook
We continue to add to dynamic and investor‑focused portfolios only when clear, validated market signals appear. The investor portfolio’s exposure has been halved, while the dynamic portfolio maintains a short stance on a U.S. index until its reversal pattern is definitively rejected. Risk taking will stay measured; we will only increase exposure after decisive breakthroughs of the key technical levels outlined above.