

The S&P 500 is staying near the same level it held in early August. Even though daily moves go up and down, the overall direction is flat.
We can see why the index is stuck by looking at its price momentum. In this article we will explore the Relative Strength Index (RSI), use simple “range rules” to check the trend, and think about what might happen next.
Strong uptrends need strong momentum
First, let’s look back at 2025. After a sharp drop in April, the S&P 500 moved above its 200‑day moving average and kept climbing for about eight months.
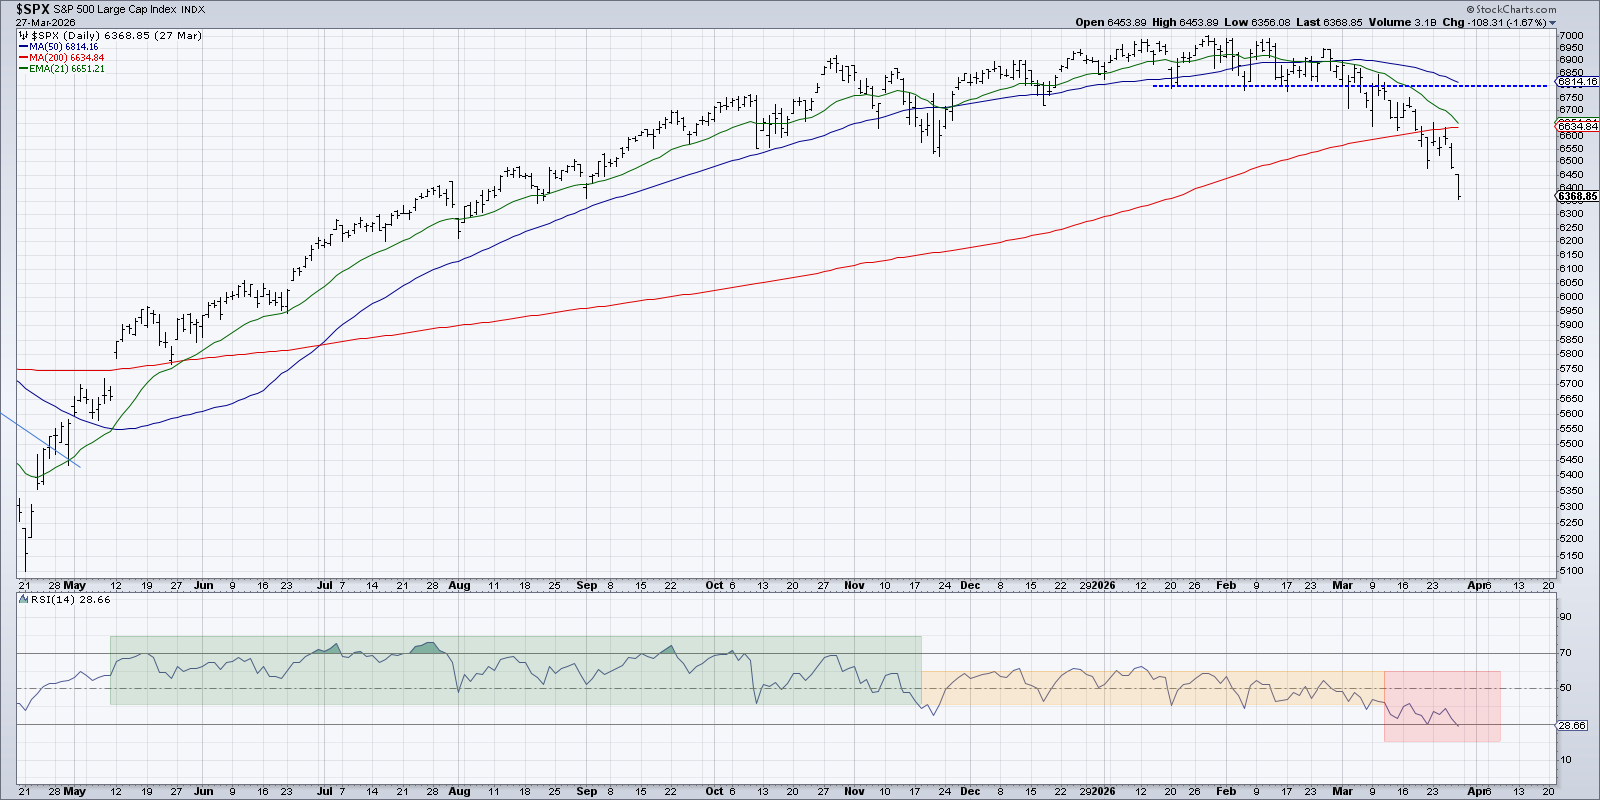
During that rise, the RSI stayed in a bullish zone. When the index made a new high, the RSI often rose above 60, and it never fell below 40 during pull‑backs.
In a healthy uptrend, we simply watch that the RSI stays above 40 when the price pulls back. Each time it does, it means buyers are stepping in on the dip.
When upside fades, buying power drops
In November 2025 the pattern changed. The S&P 500 hovered near record highs, but the RSI rarely rose above 60. For four months the RSI stayed between 40 and 60, showing a side‑ways market where buyers and sellers were balanced.
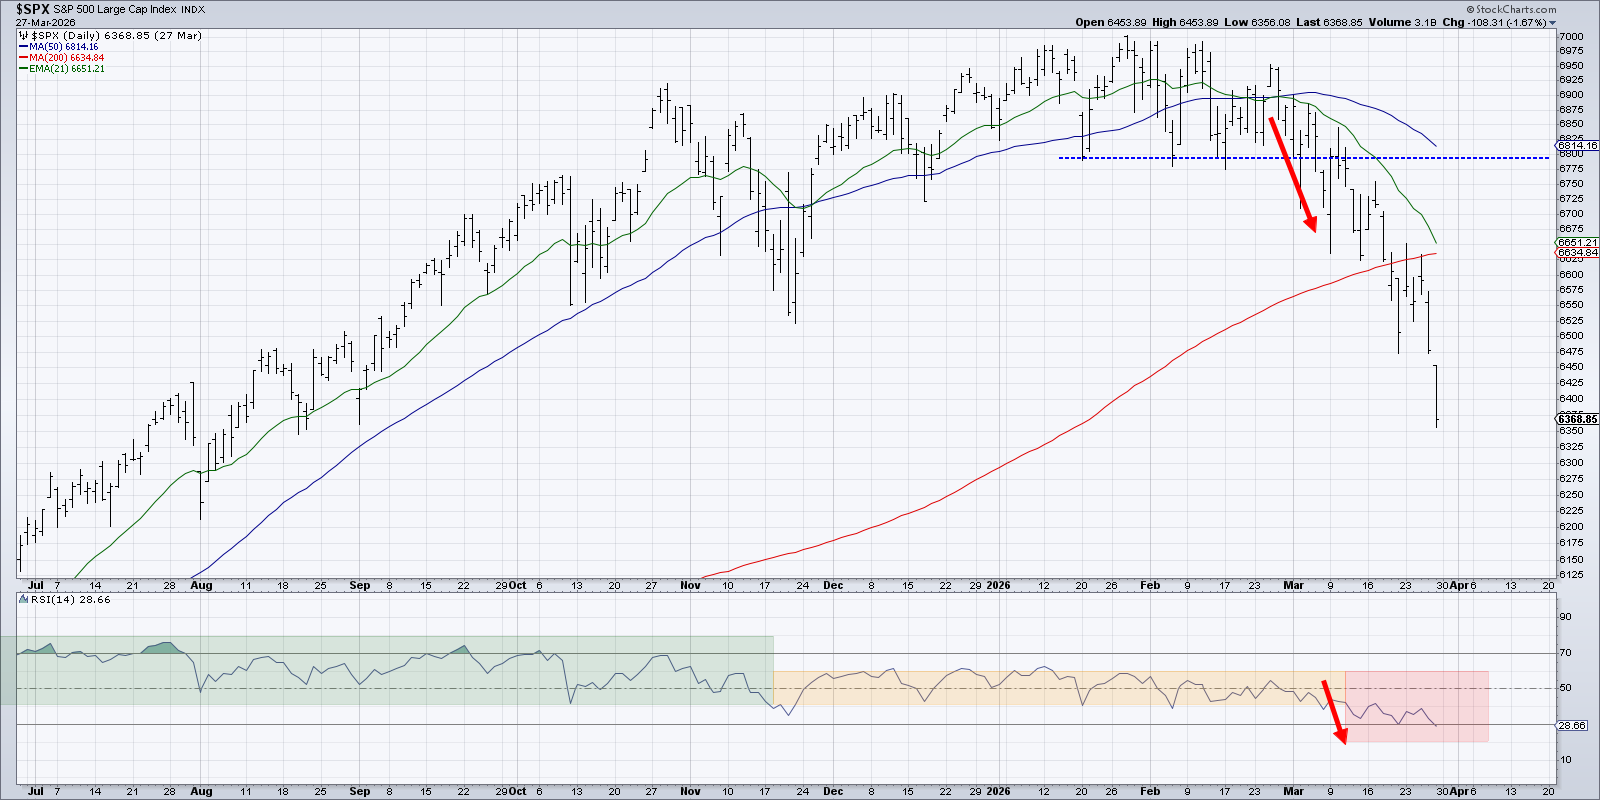
When the index finally slipped below a clear support level around 6,800 in March 2026, the RSI dropped out of the neutral zone and entered oversold territory. More down days signaled a new distribution phase, pushing the index lower.
What the current chart tells us
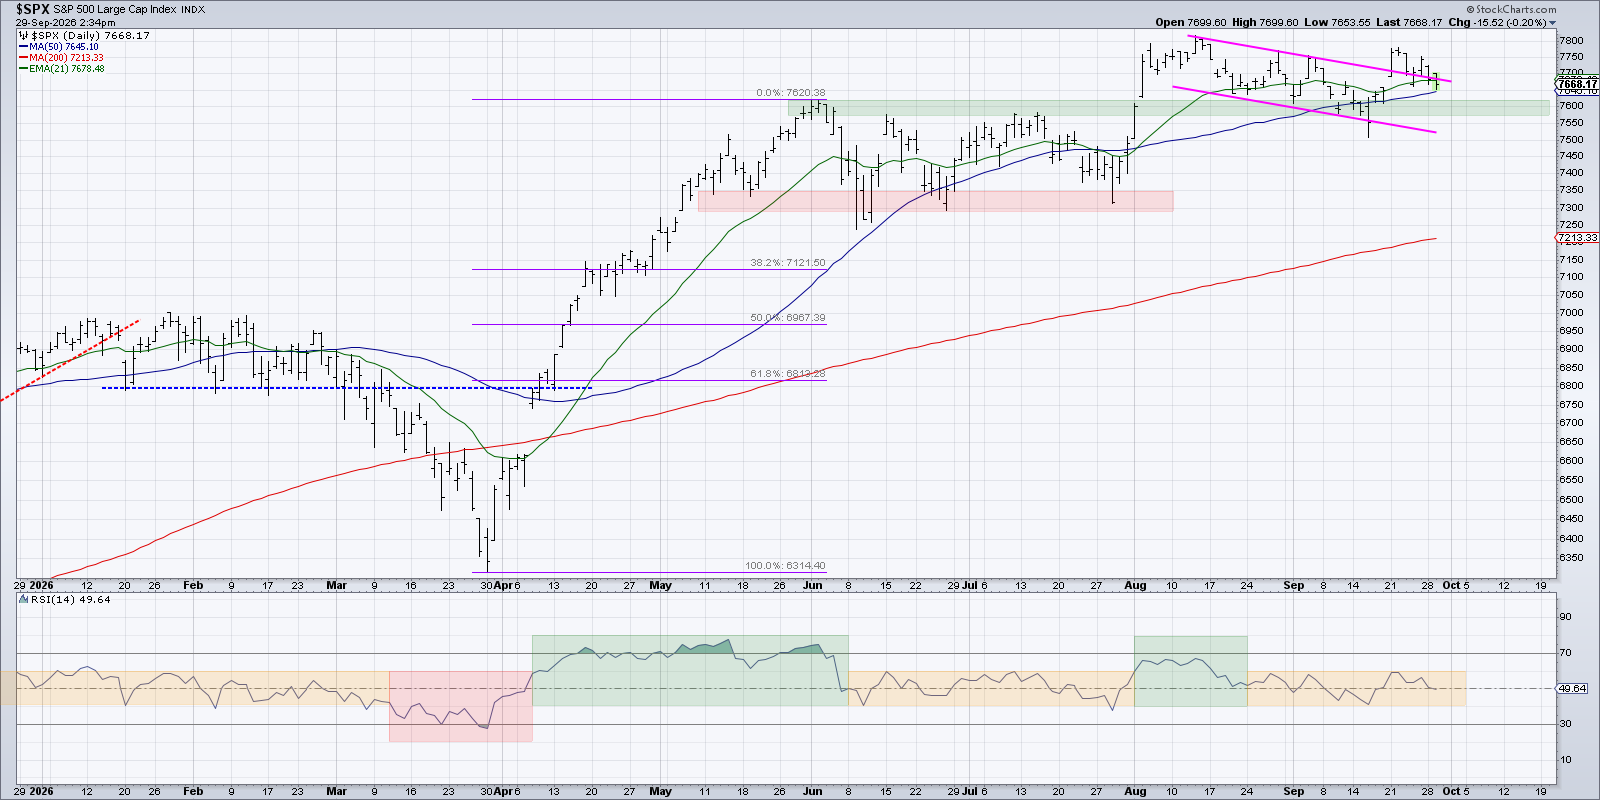
The S&P 500 recently broke the 7,800 mark for the first time. Yet over the past five weeks the RSI has lingered between 40 and 60, showing weak buying interest.
If the index falls as we move into the fourth quarter, the next key support level to watch is around 7,600. More important is the RSI reading. A break below the neutral range often leads to a sharper decline.
Disclaimer: This content is for educational purposes only and does not constitute financial advice. Always consider your personal situation and consult a professional before making investment decisions.
Source: Materials provided by https://articles.stockcharts.com.Note: Content may be edited for style and length.