
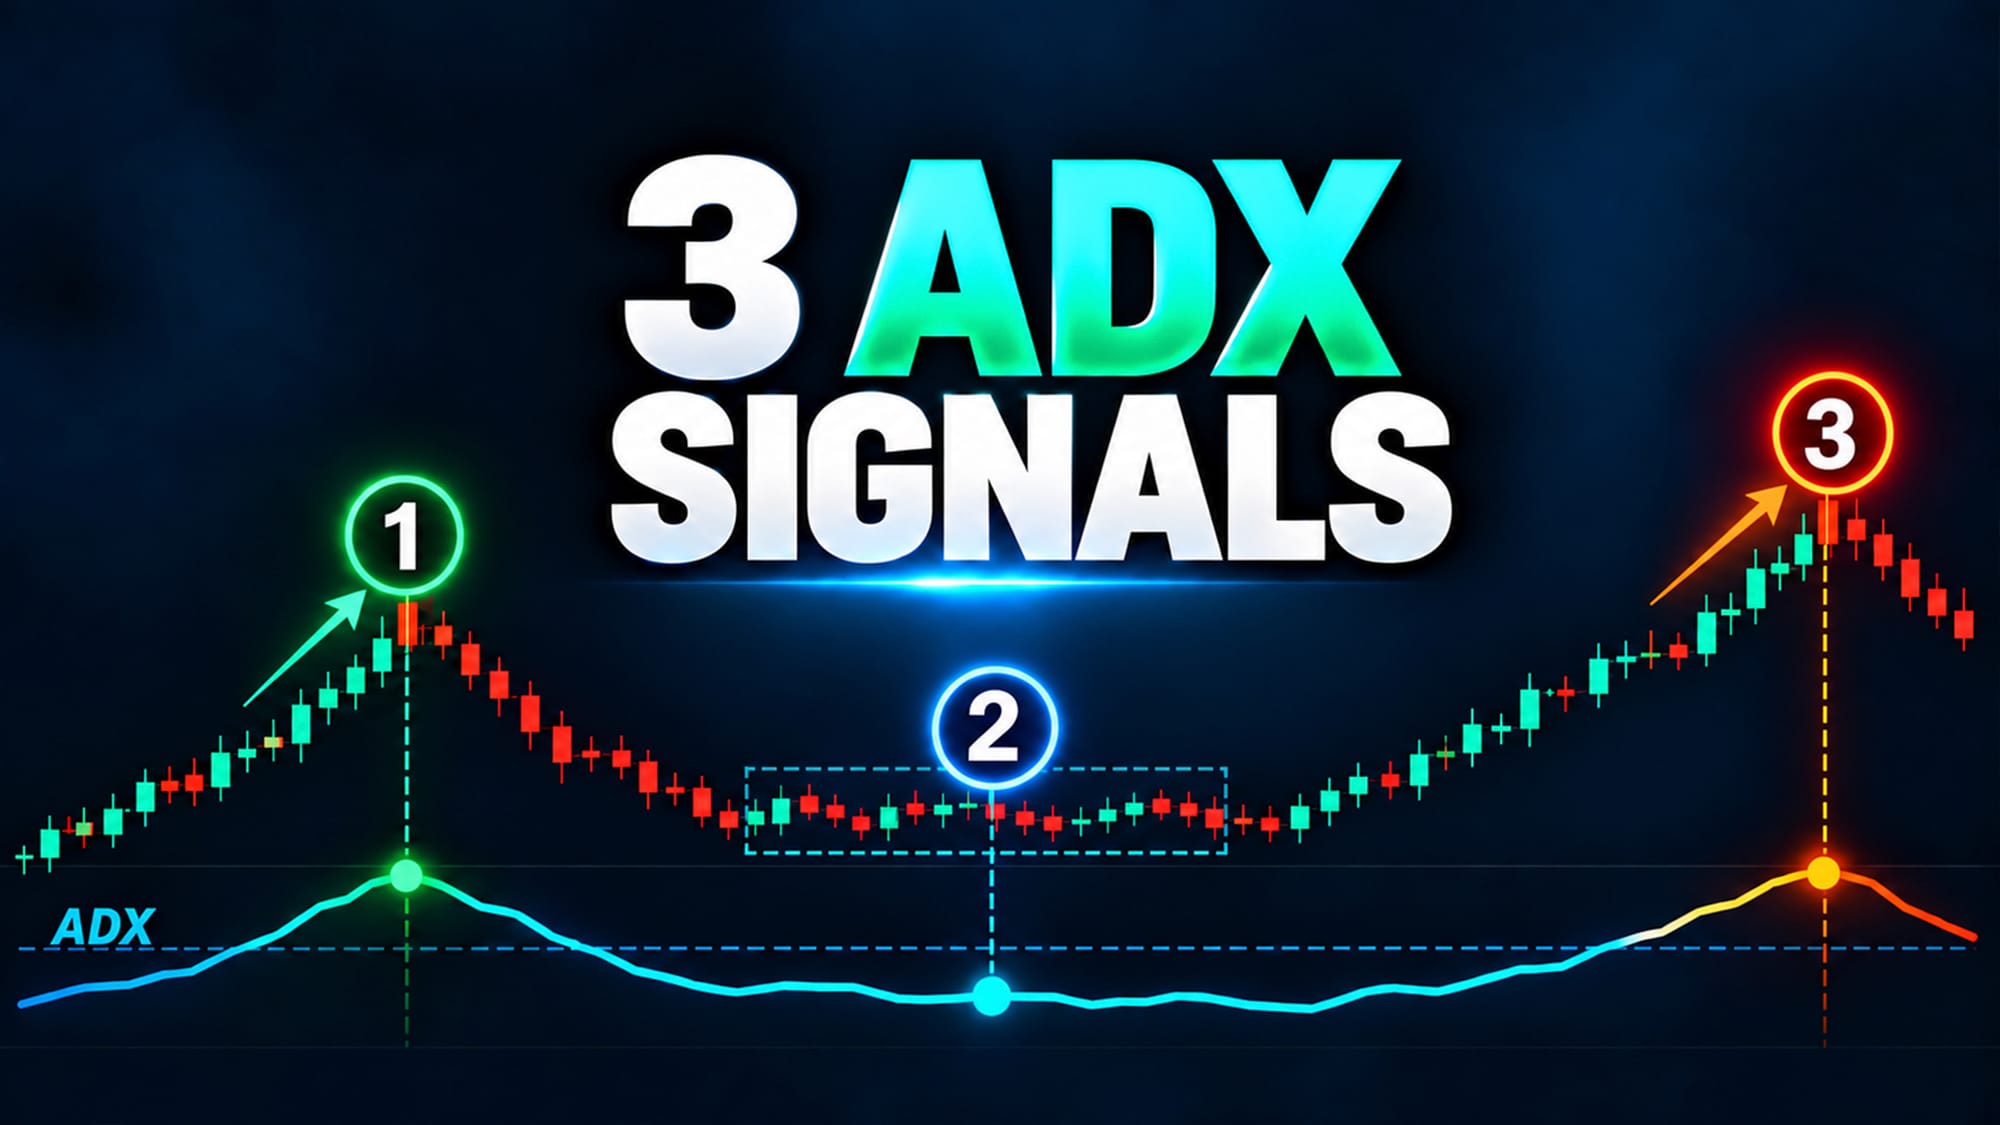
ADX shows whether a price move is strong or weak. It also helps you see possible breakouts, check if a pullback is still healthy, and notice when a trend might be fading.
Three easy ways to use ADX involve the ADX line, the green and red DI lines, and the price action on different time frames.
Imagine looking at the 10‑Year Treasury yield and a stock like JPMorgan. By watching the ADX level at 25, the DI lines, trend lines, and simple moving averages, you can tell if a dip is just a pause or the start of a new direction.
When the ADX stays low for a long time, it often means a breakout is coming. If the price makes a new high but the ADX does not rise, the trend may be losing power. Watching the green DI (buying pressure) and red DI (selling pressure) can show who is in control.
Use this simple framework on any chart. Look at the ADX, compare the DI lines, add a few trend lines, and watch the moving averages. If the ADX weakens while price climbs, think about protecting your gains.
Source: Materials provided by https://articles.stockcharts.com.Note: Content may be edited for style and length.