

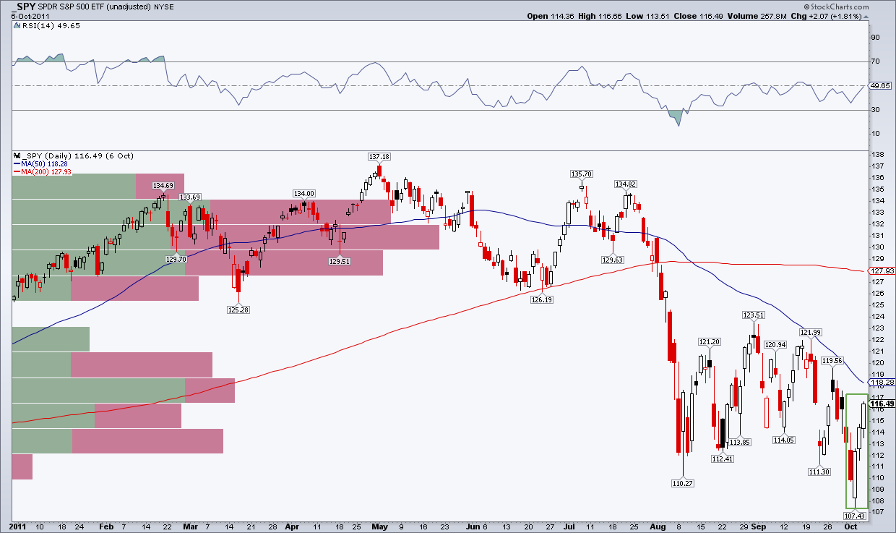
In October 2011 the S&P 500 hit a low of 1075. From that point the market rose a lot, giving investors huge gains over the next fifteen years.
Large‑cap U.S. stocks grew more than 800 %, turning a $10,000 investment into almost $91,000. The Nasdaq‑100 ETF climbed over 1,500 % with a compound annual growth rate of about 21 %.
A Simple Candlestick Pattern
The chart that marked the 2011 low showed a formation called three white soldiers. It is made of three consecutive long white candles. Each candle opens inside the body of the previous one and closes near its high. Traders often see this shape as a sign of a strong upside move.
Today's Signals
Even now, similar three‑soldier patterns are showing up in different markets.
Bond Market
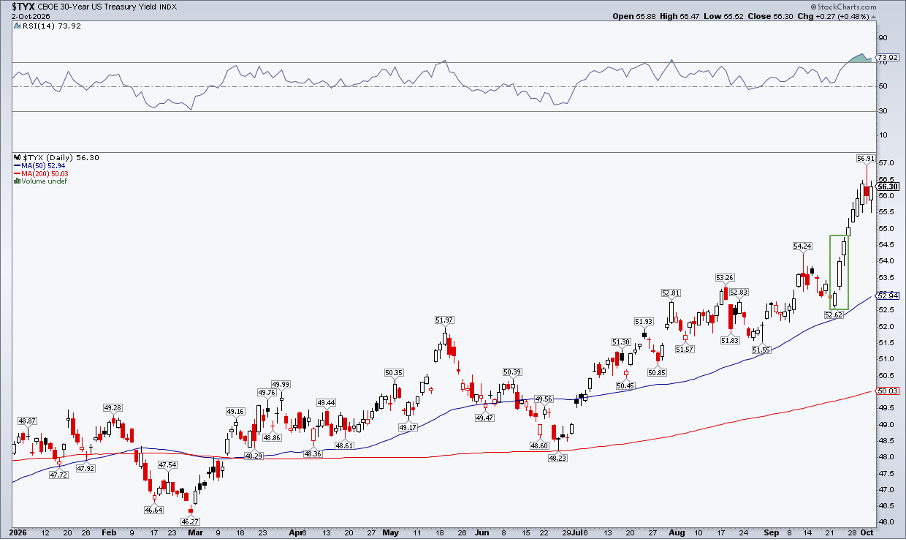
The 30‑year U.S. Treasury yield rose sharply in early autumn 2026. The first three days formed a white‑soldier shape, kicking off a short‑term rally that lifted the yield by 43 basis points.
Technology Stocks
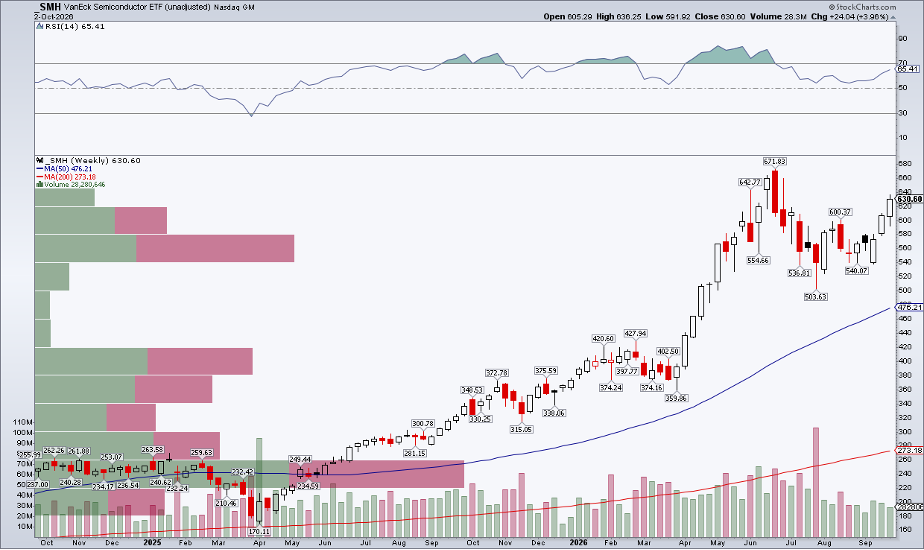
The VanEck Semiconductor ETF (SMH) has displayed a clear three‑white‑soldier pattern on its weekly chart. After a big rally earlier in the year, the ETF has closed each of the last three weeks near its weekly high, suggesting another upside move could be coming.
U.S. Dollar
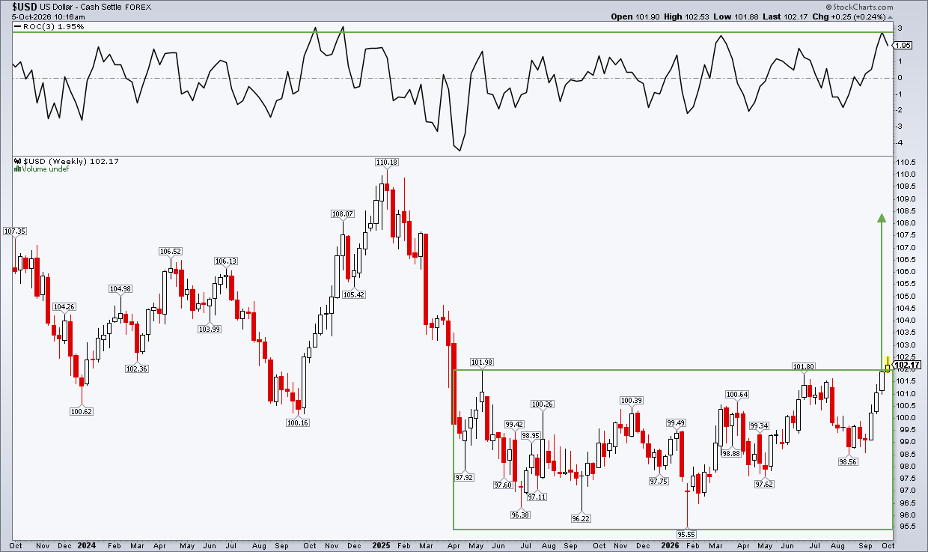
The cash‑settled dollar also formed three white soldiers in early October, pushing the currency to its best level since April 2025. The pattern hints at a possible rise toward the 108.5 target.
Why Candlesticks Matter
Candlestick shapes are easy to spot and work on any time frame. While no pattern is perfect, the three‑white‑soldier is a useful clue for traders who want to catch early reversals.
Bottom Line
The 2011 three‑white‑soldier pattern started a long bull run for U.S. large caps. Today, similar patterns are appearing in bonds, semiconductor stocks, and the dollar, each telling its own story. Watching these candlesticks can help traders see where price may head next.
Disclaimer: This article is for educational purposes only and does not constitute financial advice.
Source: Materials provided by https://articles.stockcharts.com.Note: Content may be edited for style and length.