
This week the major U.S. indexes closed at record levels. The S&P 500 and Dow Jones Industrial Average both made new highs, while the Nasdaq posted its strongest week since April. Gold prices rose, and the VIX volatility index fell. The overall market mood stays bullish.
- Key sentiment gauges
- Where is crypto?
Stocks jumped after news of a possible peace deal between the United States and Iran. When the agreement fell through, the market slipped a bit, then rose again after a weak jobs report. Investors now seem less worried about a September rate hike.
Besides the VIX, I watch the Cboe Options Equity Put/Call Ratio (CPCE) to feel the market’s mood. This ratio helps spot extreme fear or greed among traders.
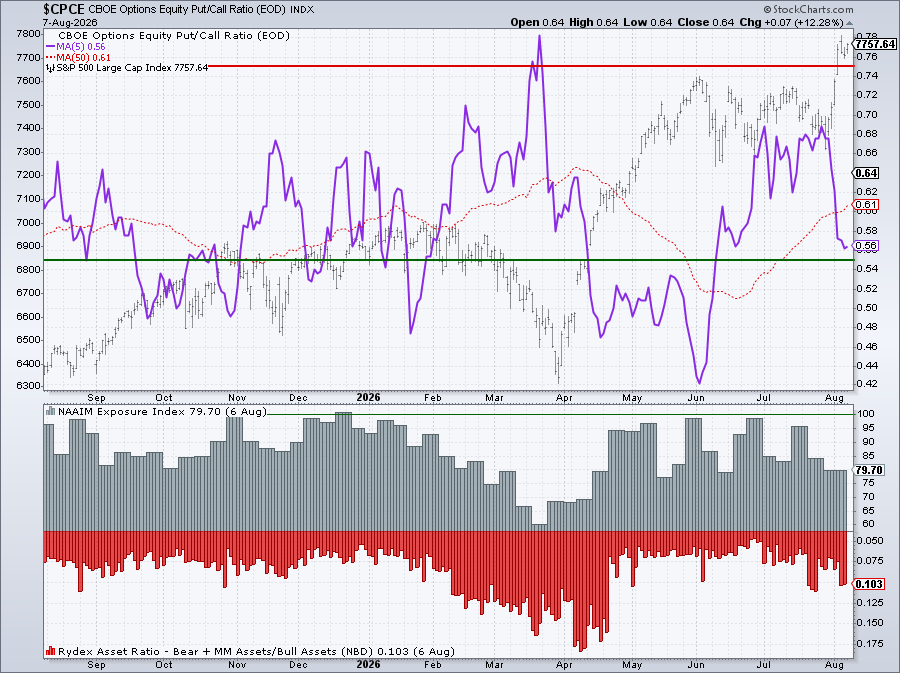
The purple line in the chart shows a five‑period moving average of the CPCE. The raw ratio can jump wildly, making it hard to read. Smoothing the data lets us see clear peaks and valleys.
Those peaks line up with the tops and bottoms of the S&P 500. Right now the moving average is not at an extreme, but it sits closer to the lower side. If it climbs toward the upper limit, that could be a warning sign. The ratio itself isn’t a buy or sell trigger; it simply reflects how investors feel.
Two other tools add context: the NAAIM Exposure Index, which shows whether big institutions are bullish or bearish, and the Rydex Asset Ratio, which measures the overall market bias.
The first week of August ended on a positive note. Stocks performed well, gold kept rising, bond yields fell, and oil stayed steady.
What About Crypto?
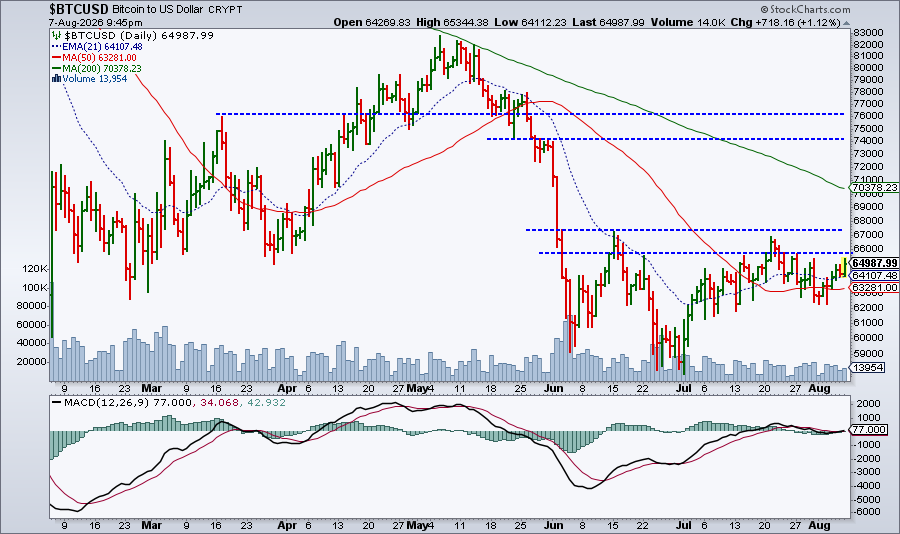
Cryptocurrencies still need a clear bounce to prove that risk appetite is fully back. Bitcoin has recovered from its July lows, but it still has work to do.
Enjoy the weekend and happy charting!
Source: Materials provided by https://articles.stockcharts.com.Note: Content may be edited for style and length.