


Last week I said that commodities were facing two big battles that would decide their next move. New data now points to an upward breakout, especially from the SPDR Energy ETF (XLE).
Chart 1 shows XLE breaking out of an inverse head‑and‑shoulders shape. Both short‑term and long‑term momentum tools stay firmly positive.
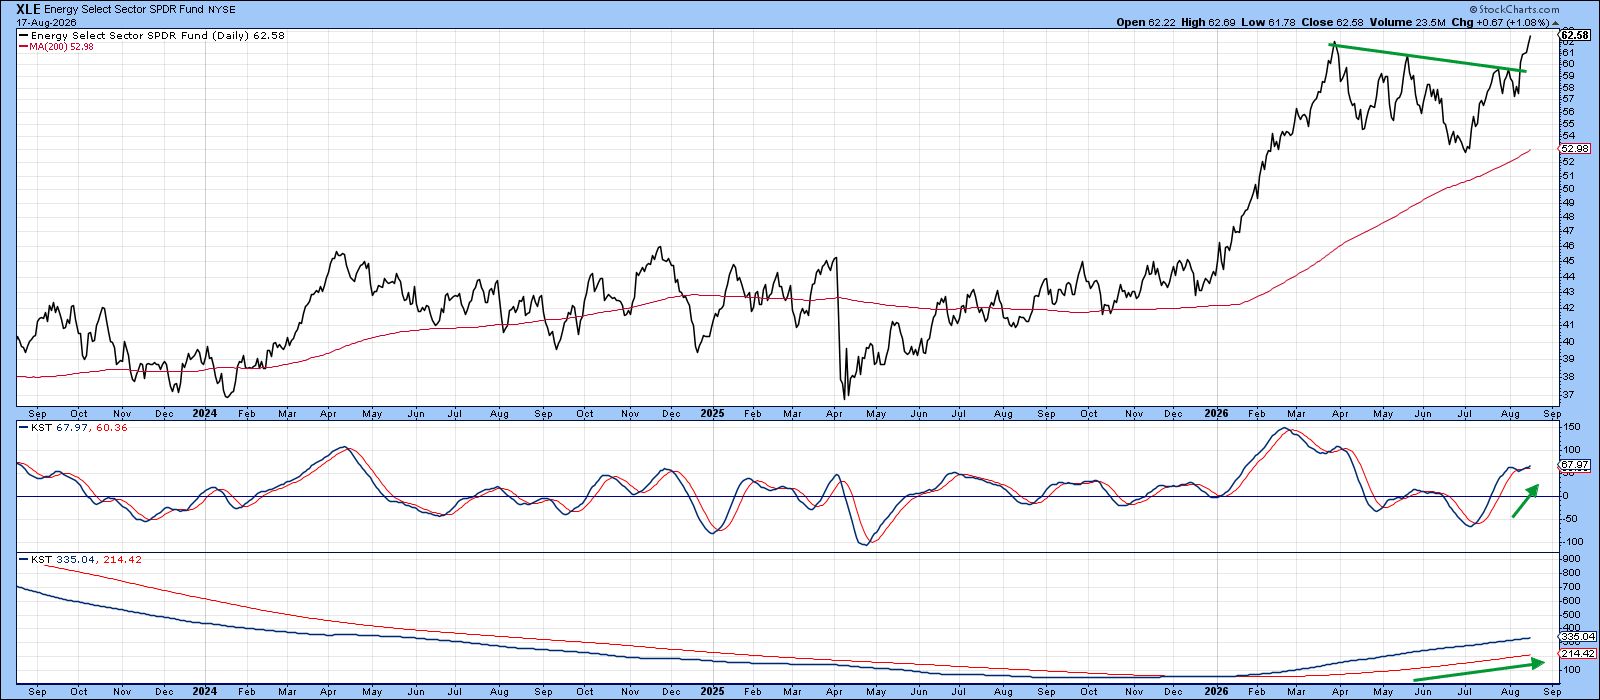
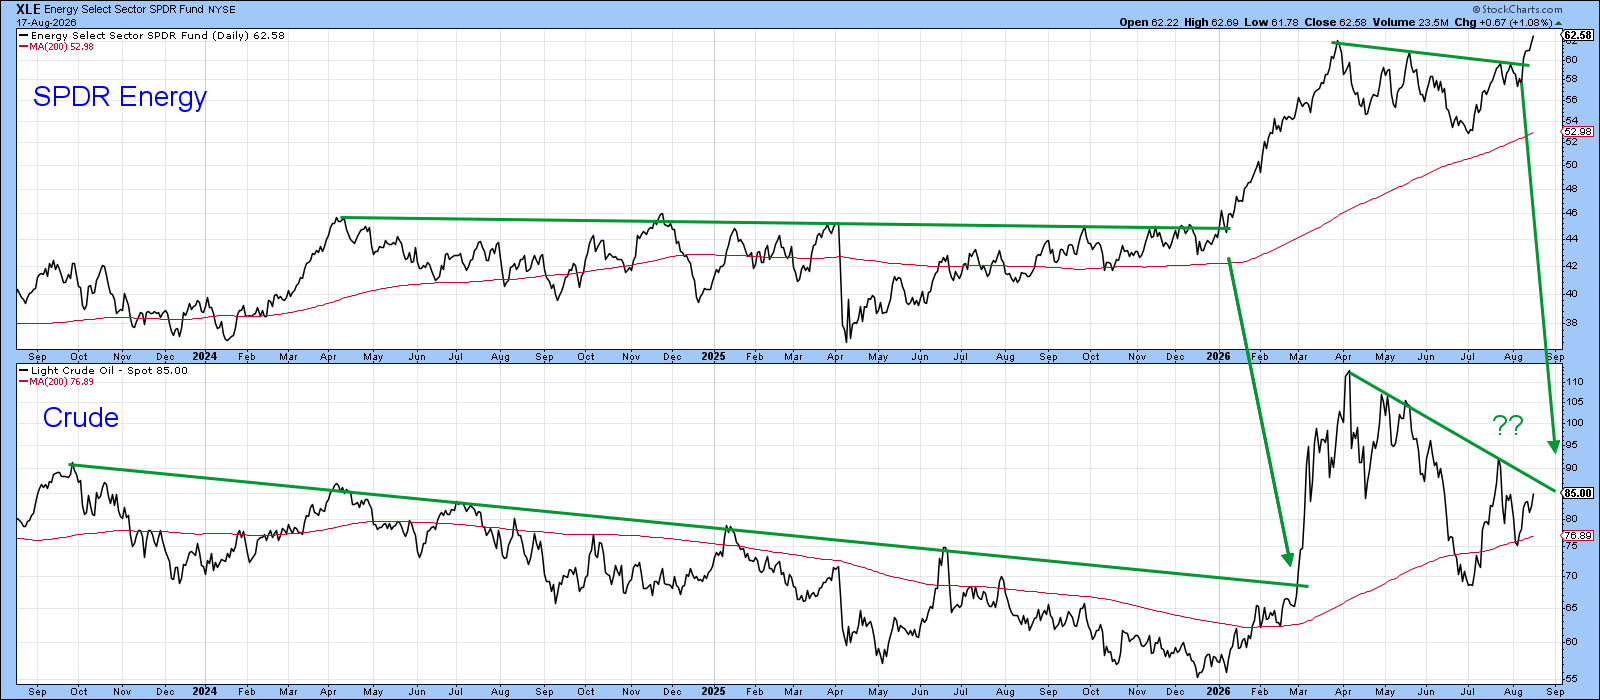
Chart 2 shows that XLE led the early 2026 rally and is leading again. West Texas Intermediate crude is close to breaking its intermediate‑term downtrend line. If it does, the ETF’s bullish move gets stronger proof that oil is returning to its main uptrend.
The Commodity Cycle Is Bullish for Oil
Gold, copper, and oil move in a regular order during a business cycle. Gold, a monetary asset, usually peaks first when investors expect tighter money policies and higher real rates.
Copper, known as "Dr. Copper," reacts to industrial activity. It often starts to fall before a slowdown shows up in normal economic data. In the current cycle copper’s momentum is still rising, so it has not yet turned down.
Oil typically moves last. Even after copper begins to drop, energy demand can stay strong, pushing oil prices to their highest points later in the cycle.
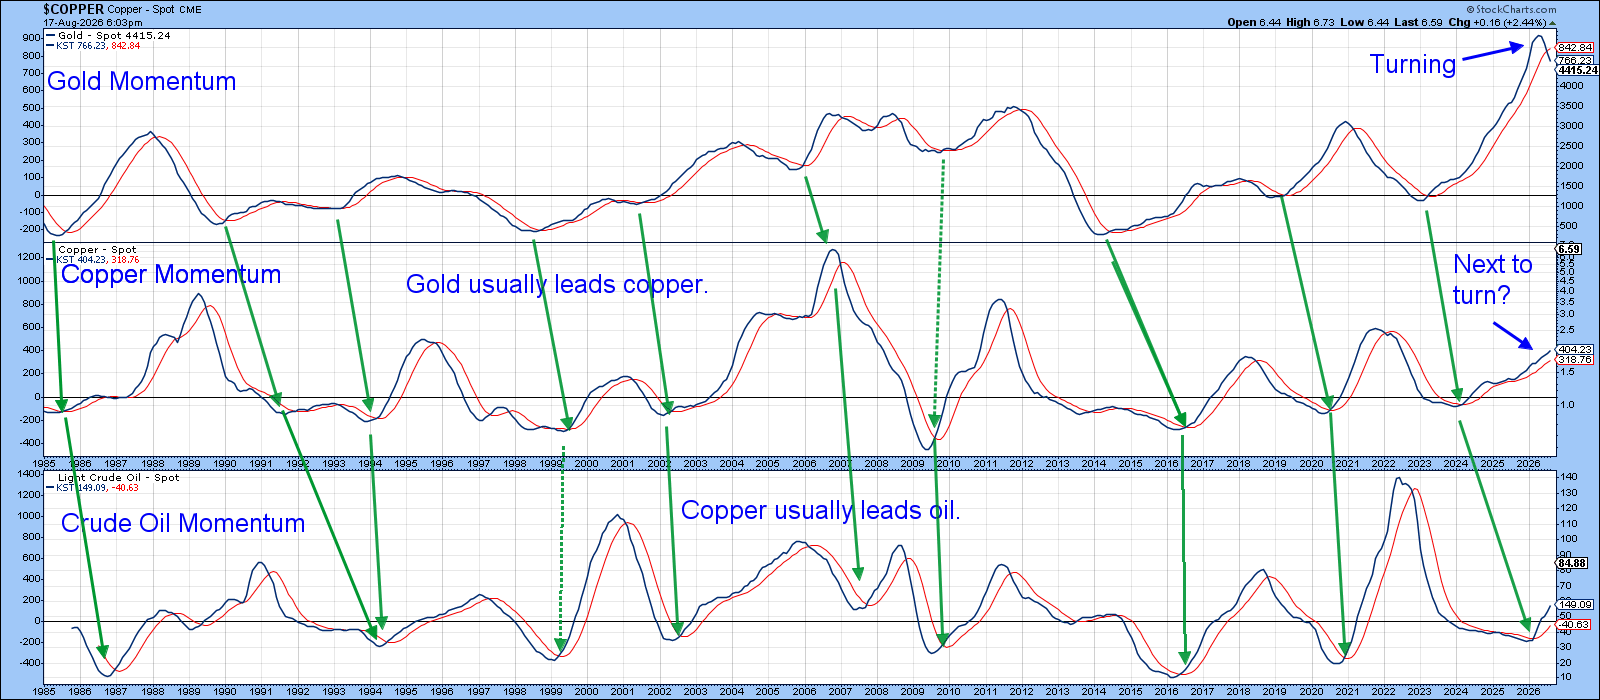
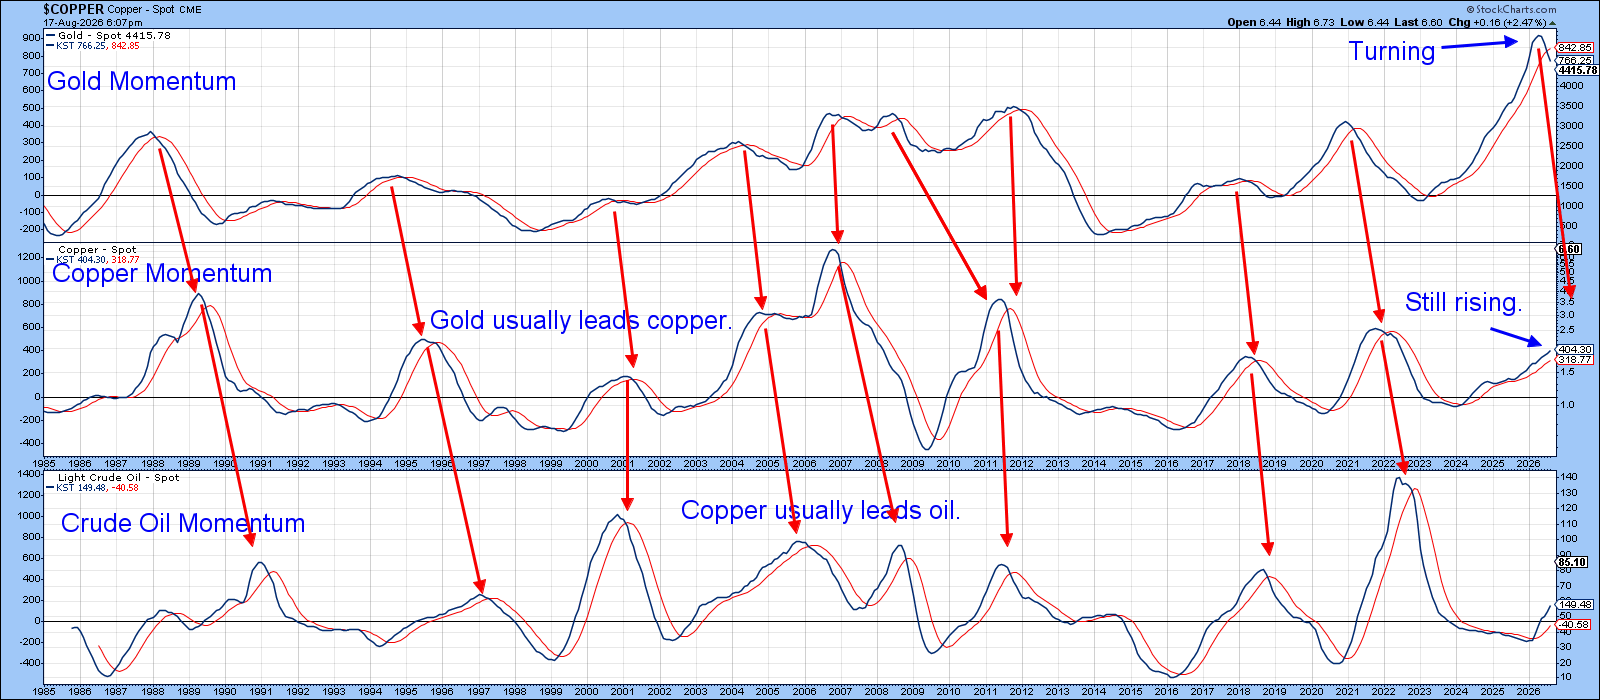
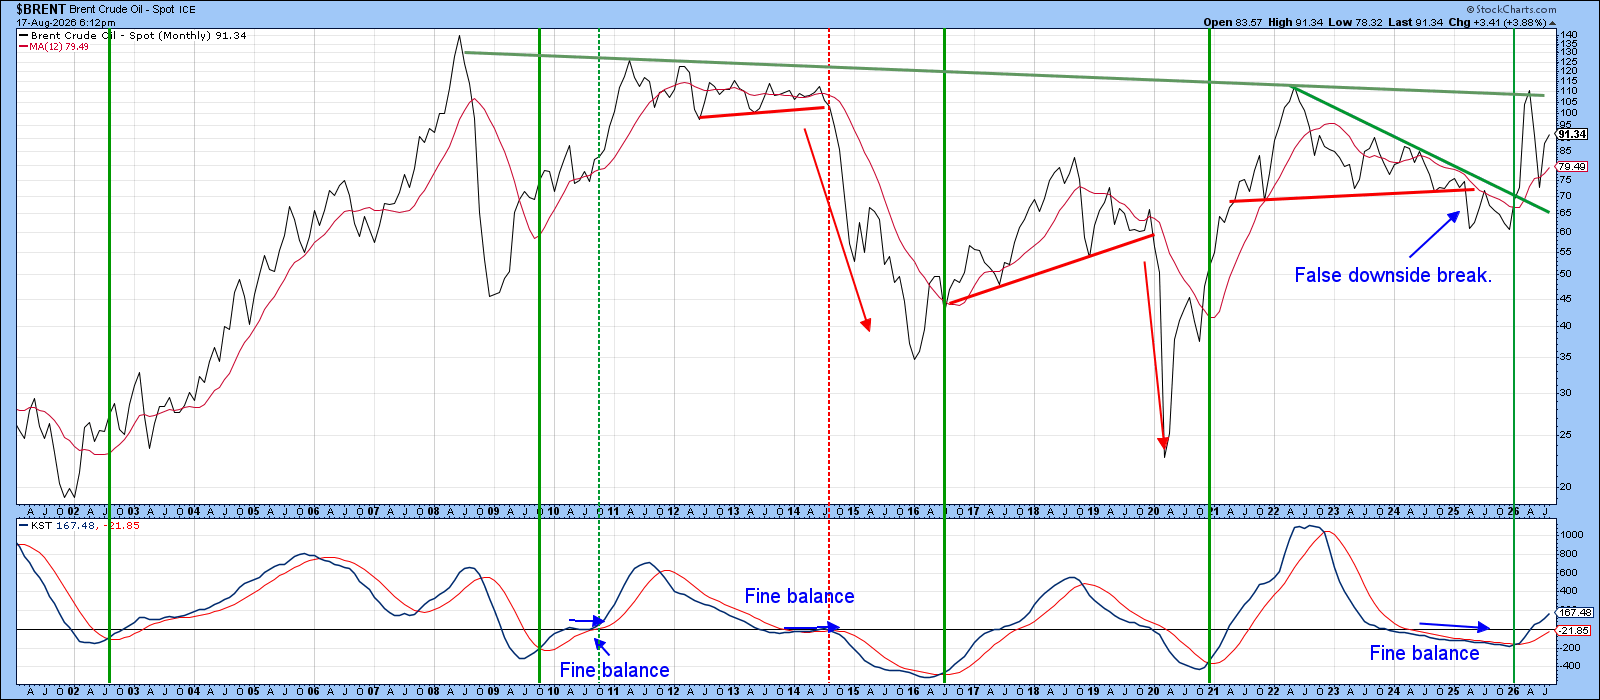
Chart 5 shows Brent crude hovering near the neckline of a possible multi‑decade inverse head‑and‑shoulders pattern. If the pattern finishes, it would suggest much higher energy prices for the next few business cycles.
The Bottom Line
Oil‑related stocks are breaking to the upside. History tells us that crude prices often follow a similar path, though it is not guaranteed. If Brent completes the large breakout pattern, the effect could spread to many other commodities, push interest rates higher, and add pressure to an already expensive stock market.
Source: Materials provided by https://articles.stockcharts.com.Note: Content may be edited for style and length.