


All eyes are on NVIDIA (NVDA) as it prepares to release its second‑quarter numbers on August 26. The company is the biggest name in artificial‑intelligence chips, and its results could move the whole market.
NVDA vs. the S&P 500
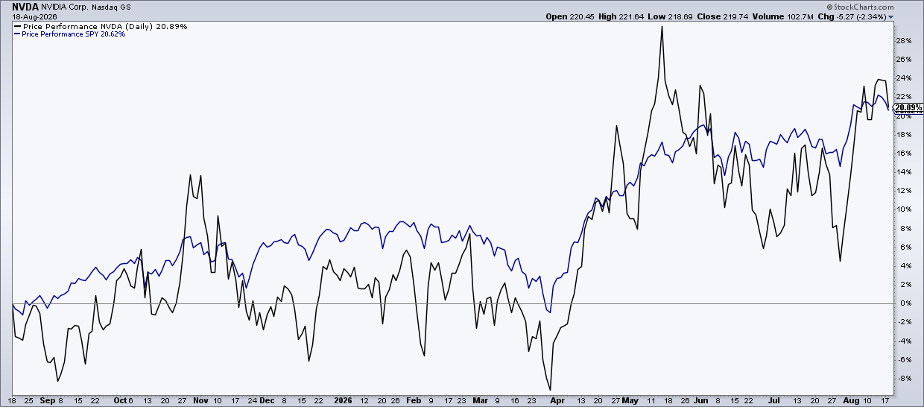
Over the past year NVIDIA’s stock has moved almost exactly the same as the S&P 500. Both have returned about 21 % total gain. The difference is that NVIDIA has been much more volatile – its price swings are roughly twice as big as the index’s.
Bullish Trend Still Intact
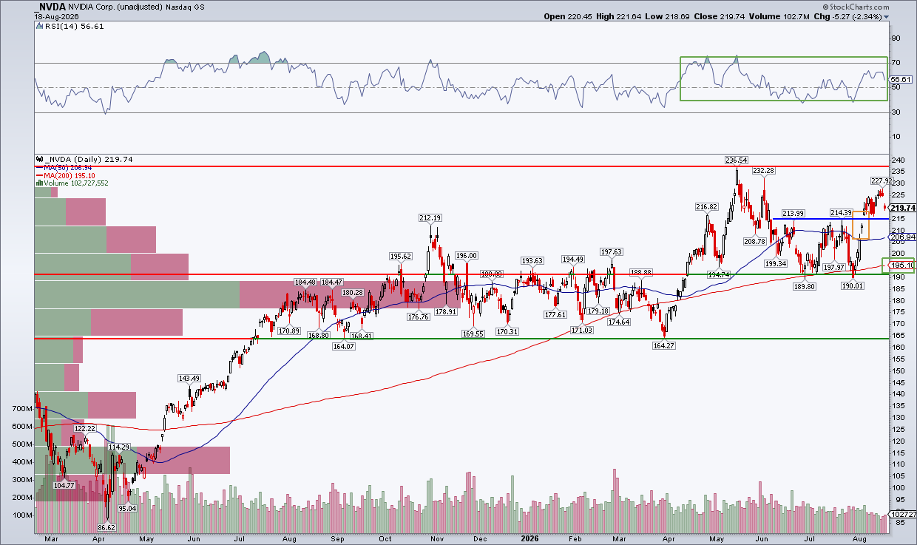
The long‑term 200‑day moving average for NVIDIA is rising, which means the overall trend is still upward. The chart shows higher highs and higher lows throughout 2024, even though there were short periods of weakness.
Two small gaps appear near $212 and $207. If the price falls into those gaps before the earnings release, it would not be a big problem for long‑term investors.
Momentum Check
The RSI (relative strength index) sits between 40 and 75, a range that is considered bullish. It has not broken the 70 level since the all‑time high three months ago. A move above the recent peak of $236.54 with strong volume would confirm a new uptrend.
Can NVIDIA Reach a New Record?
Technical analysis points to a price target near $239. This comes from adding the recent $25 price range (June‑July) to the breakout level at $214. If the stock climbs toward that level before Labor Day, it could set a fresh all‑time high.
Valuation Snapshot
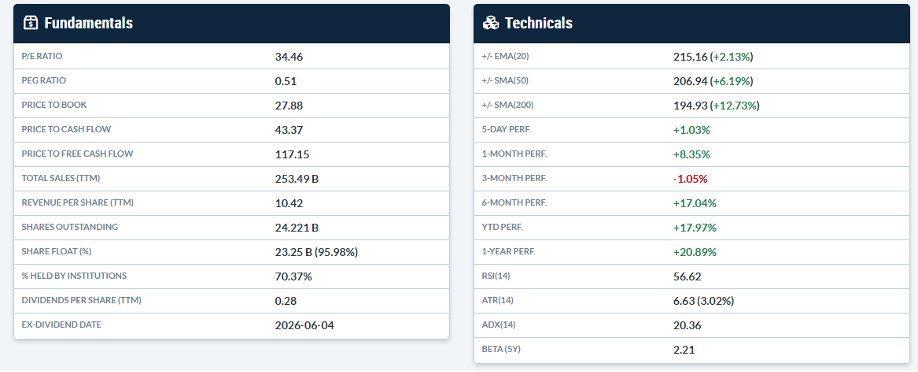
Even at $239, NVIDIA’s forward price‑to‑earnings (P/E) ratio would sit in the low 20s, close to the market average. Using FY 2027 earnings estimates, the forward P/E would stay in the high teens.
Key Support Level
If the stock falls, the next important support area is around $190. The 200‑day moving average also sits near this zone, providing an extra cushion. A big drop below $190 would require a strong bearish shift in sentiment.
What the Chip Sector Is Doing
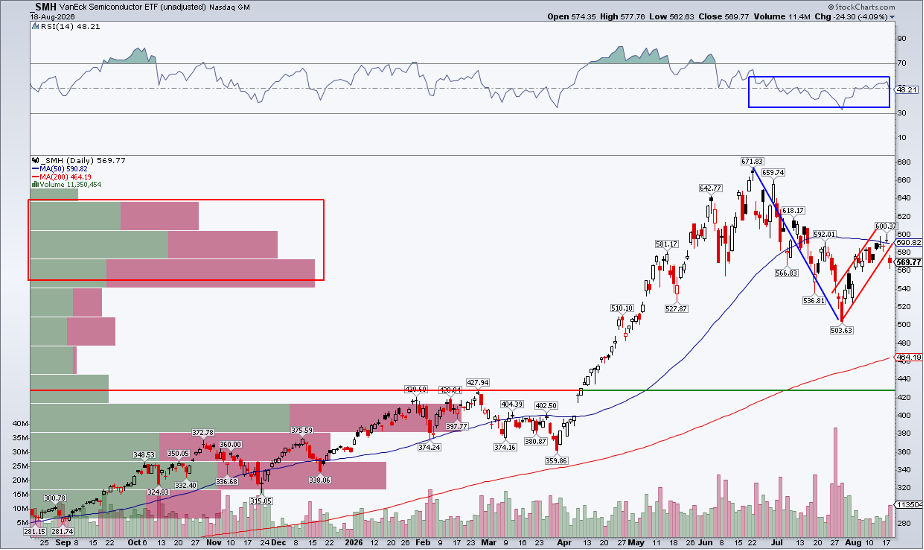
The broader semiconductor market is showing some weakness. The VanEck Semiconductor ETF (SMH) has slipped below its 50‑day moving average and is trading near a recent low. A healthy rally in the sector would help NVIDIA reach new highs; a continued decline could hold the stock back.
Bottom Line
NVIDIA will announce its Q2 earnings after the market close on August 26. The results could push the stock higher if they beat expectations, especially if the broader chip market shows strength. Traders should watch the $214 support level, the RSI range, and any movement in the semiconductor ETF for clues about the next move.
Disclaimer: This content is for educational purposes only and does not constitute financial advice.
Source: Materials provided by https://articles.stockcharts.com.Note: Content may be edited for style and length.