
Gold ETF GLD Shows Classic Bollinger Band Squeeze
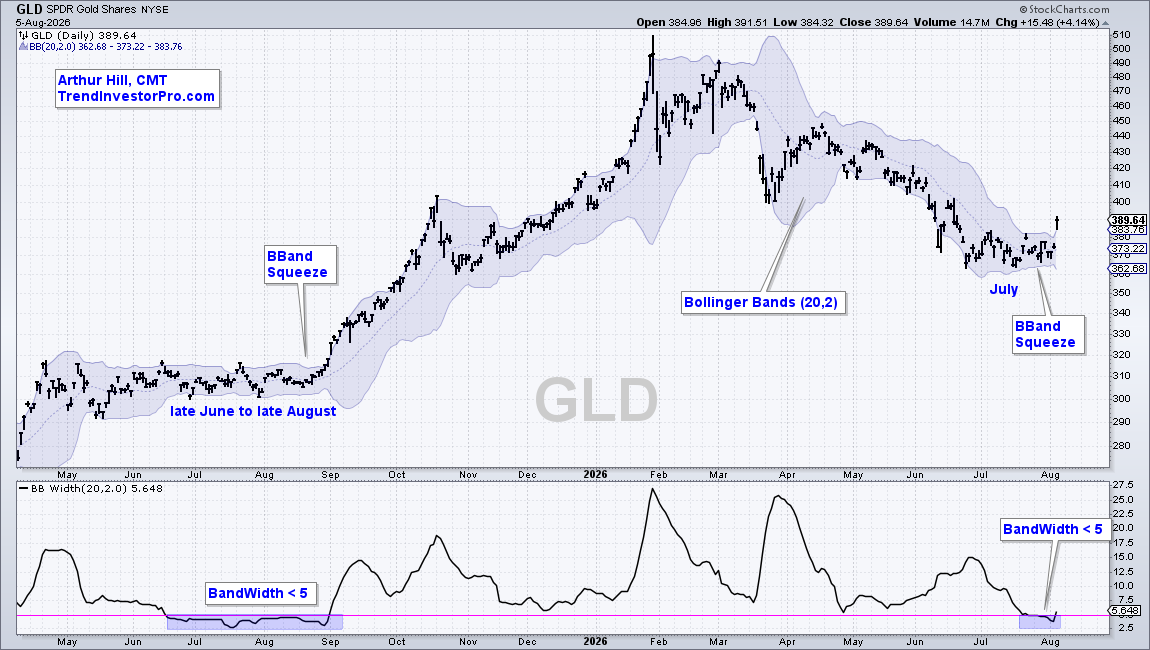
In July the SPDR Gold Shares (GLD) settled into a tight price range. The Bollinger Bands narrowed, which often means a big move could be on the way.

When the bands shrink, traders call it a “squeeze.” History shows that after a squeeze the price often explodes outward. This pattern appeared in August 2025 and is happening again now.
How the Squeeze Is Measured
Bollinger Bands use a 20‑day moving average with two standard‑deviation lines. The BandWidth indicator measures the distance between the upper and lower bands. In July the BandWidth fell below 5, indicating a tight squeeze.
What Happened Next?
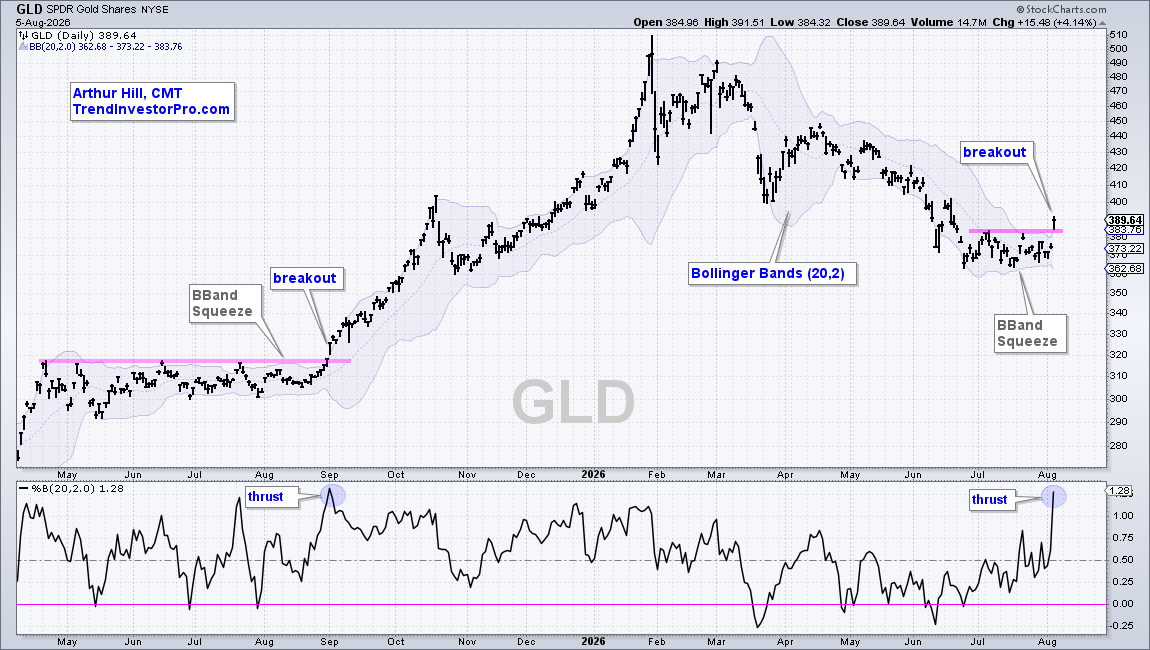
After the squeeze, GLD pushed past its recent resistance level. The price moved above the upper Bollinger Band, and the %B value rose to 1.28, showing strong upward momentum.
What Traders Look For
A squeeze alone does not tell us the direction. By watching the price break above resistance and the %B level, traders can confirm a bullish breakout.
If the price falls back below the July low, the move may need to be re‑evaluated.
Source: Materials provided by https://articles.stockcharts.com.Note: Content may be edited for style and length.